![]()
Week of January 8, 2024
Bullseye Brief explores American Ingenuity… the People, Companies and Technologies transforming our world. When I find a stock with a great story, supported by compelling data and a timely catalyst, I write a report and add it to the Bullseye Portfolio. I love what I do. -AJ 917.710.8347

Executive Summary
Special Issue: 44 Picks… 44 Paragraphs
In this special quarterly report I present one paragraph per pick, highlighting why I’m long and what I expect.
Actionable Trades
Buy – MRVL, VC
Sell – EVR
Picks Making News
BXP, CRM, EXPE, MSFT, WYNN
Also in this Issue
Catalysts Next Week
Portfolio Performance
Trader Talk: Earnings Growth
Bullseye View on Stocks, Bonds, Oil, Gold, Dollar
Bullseye View
S&P 500 Index 4,686 -1.74% YTD
Pause that Refreshes – Stocks pullback slightly in the first week of 2024 after last year’s 24% rally, which was punctuated my the best year-end rally in a decade. Fine. Earnings and GDP are rising faster than expected. Inflation is coming down and the Fed is poised to cut rates. I am comfortable adding to positions on weakness.
10-yr Treasury 4.05% (vs. 3.72% 1-yr ago)
Potato Po-TA-to – Rates rise above 4% for the first time in a month as traders ratchet back rate cut assumptions. Fed fund futures now predict two cuts by July with 95% certainty, compared to three cuts by June with 100% several weeks ago. Whatever. Inflation is coming down and rate cuts will happen. It’s just a question of timing.
Dollar Index (DXY) 102.68 -2.51% (1-yr chg)
Like Clockwork – USD rallies with rates, since higher rates of return provide more incentive for non-US investors to hold dollar-denominated assets. USD fell 5% in Q4 on rate-cut expectations, but as the world’s reserve currency, it never falls too far. Reassuring to see the Laws of Nature remain in effect.
Gold $2,051/oz. +11.55 (1-yr chg)
Dead Money? – Gold has finally rallied above $2,000. But will it stall here for a fourth time in five years? We’ve had a US debt downgrade, 50-year inflation highs, runaway deficits, border chaos and revolt on Capitol Hill… and yet gold can’t seem to breakout. I treat gold as a range trade. Buy gold in the $1,600s and sell it in the $2,000s.
Oil $73.64/bbl +0.14% (1-yr chg)
Crude Reality – Oil bounces slightly from a 6-month low, but the world remains well supplied. The US is producing the most ever, and exports continue to flow from Iran, Russia and now Venezuela. OPEC cutbacks have had little impact. Generally speaking, you buy oil under $65 and sell oil over $90. Otherwise, do nothing.
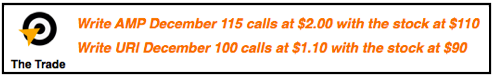
Actionable Trades
BUY
Marvell Technology Inc. (MRVL) – I will add under $50.
Visteon Corp. (VC) – I will add below $120.
SELL
Evercore Inc. (EVR) – Above my $165 target so I am closing the position.
Access all reports on the Past Issues tab, or search by ticker using the magnifying glass icon upper right.
Picks Making News
Boston Properties Inc. (BXP) – Receives its first upgrade in months, as Jefferies says negativity around commercial real estate has gone too far. Thank you! BXP has been trading at a 10-year valuation low of less than 9 times Funds From Operations (FFO) and the shares yield 5.7%.
Expedia Group Inc. (EXPE) – Rises to an 18-month high as several sell-side analysts raise earnings and targets on higher than expected travel volumes and a “no recession” scenario for 2024.
Microsoft Corp. (MSFT) – New Microsoft PC keyboards will include a new key that activates an AI-driven function called Co-Pilot. While details are vague, Microsoft suggests activating Co-Pilot will enhance functionality, from auto-completing sentences to embedding links on relevant topics.
Salesforce Inc. (CRM) – IDC predicts the customer relationship management software market will double by 2027 to $130B, which is positive for leading provider CRM and may accelerate its forecasted revenue growth above the current 11% annual rate.
Wynn Resorts Ltd. (WYNN) – Rises the most in six months as Macau gaming revenues rise 334% YoY.
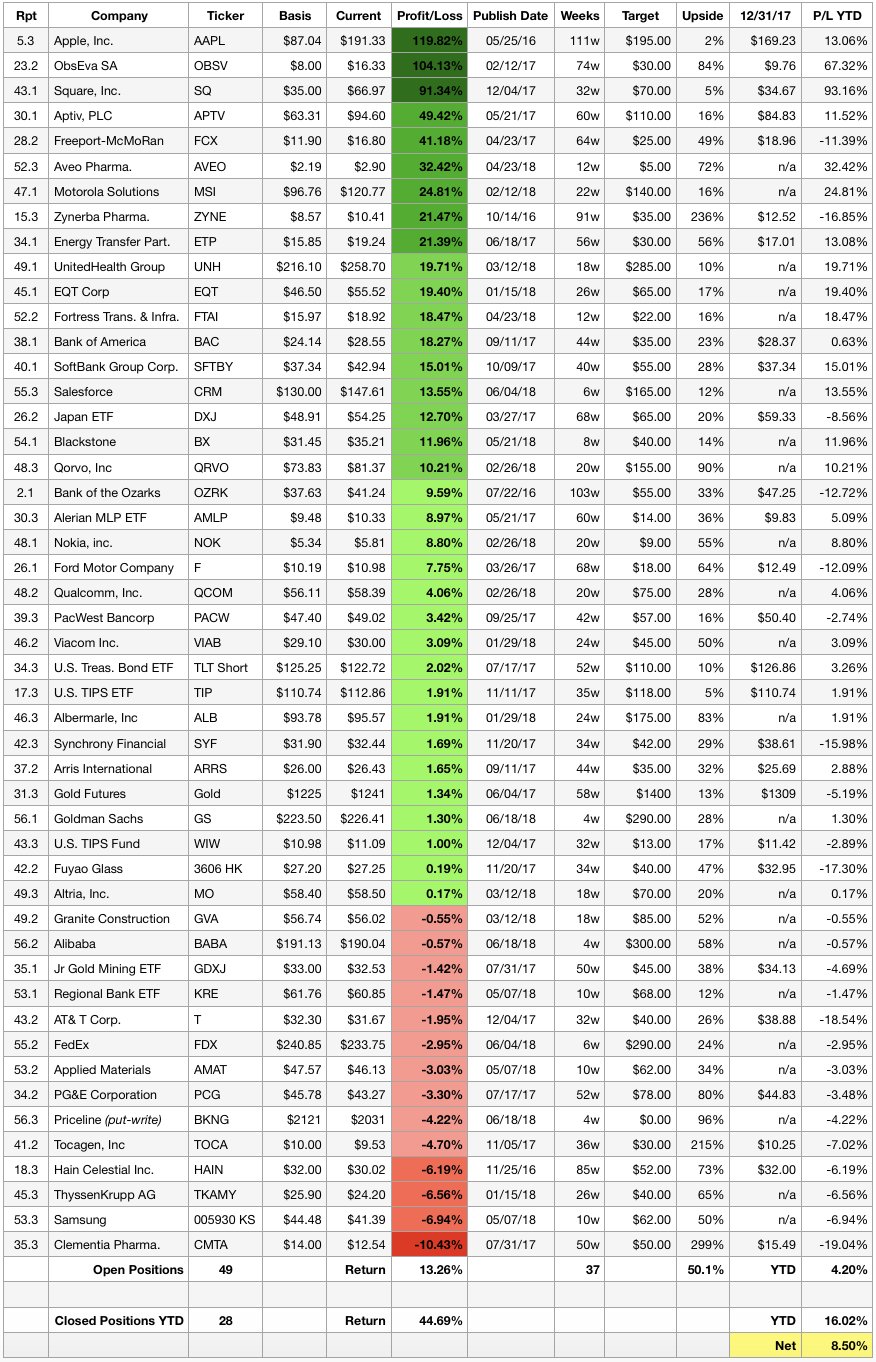
Bullseye Performance
Open Positions

Dividends paid and option premium written reduce basis when applicable.
Access all reports on the Past Issues tab, or search by ticker using the magnifying glass icon upper right.
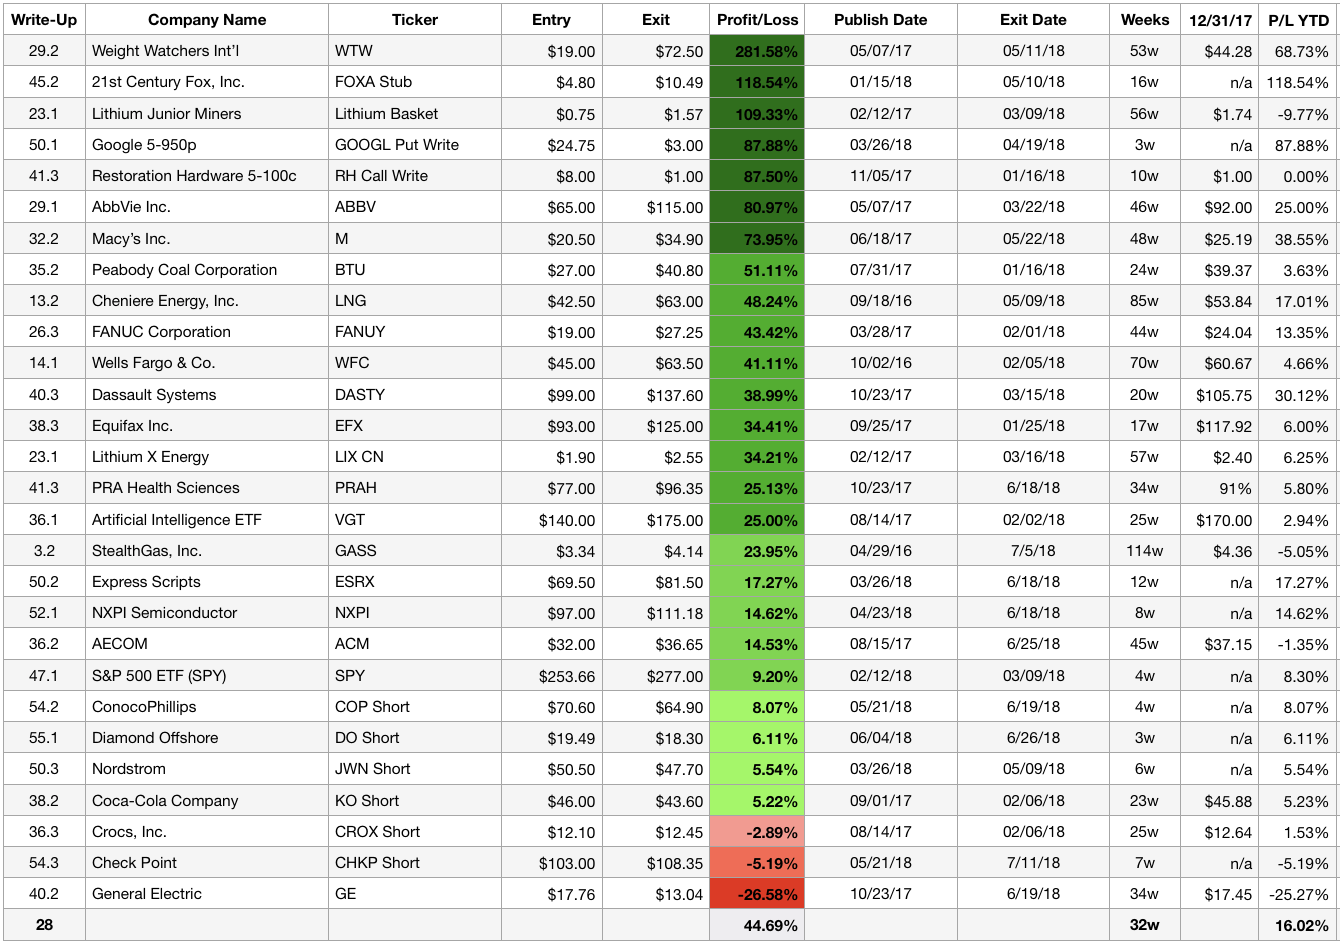
Closed Positions in 2023

Catalysts Next Week
Monday
- On This Day – In 1812, General Andrew Jackson defeats the British at New Orleans to end the War of 1812.
- Conferences – 42nd Annual JPMorgan Health Care Conference (4 days)
- Earnings – None
Tuesday
- Steady Eddy – NFIB Small Biz Optimism expected 90.8 vs. 90.6 the previous month.
- Conferences – Consumer Electronics Show
- Earnings – None
Wednesday
- Blame Rates – Weekly Mortgage Applications expected -5.0% vs. -10.7% the previous month.
- Conferences – None
- Earnings – None
Thursday
- Inflation #1 – CPI MoM expected +0.2% vs. +0.1% the previous month.
- Inflation #2 – CPI MoM expected +0.2% vs. +0.3% the previous month, ex Food and Energy.
- Inflation #3 – CPI YoY expected +3.2% vs. +3.1% the previous month.
- Inflation #4 – CPI YoY expected +3.8% vs. +4.0% the previous month, ex Food and Energy.
- Conferences – None
- Earnings – None
Friday
- Inflation #5 – PPI MoM expected +0.1% vs. +0.0% the previous month.
- Inflation #6 – PPI MoM expected +0.2% vs. +0.0% the previous month, ex Food and Energy.
- Inflation #7 – PPI YoY expected +1.3% vs. +0.9% the previous month.
- Inflation #8 – PPI YoY expected +1.9% vs. +2.0% the previous month, ex Food and Energy.
- Conferences – None
- Earnings – BAC, BLK, C, DAL, JPM, UNH, WFC
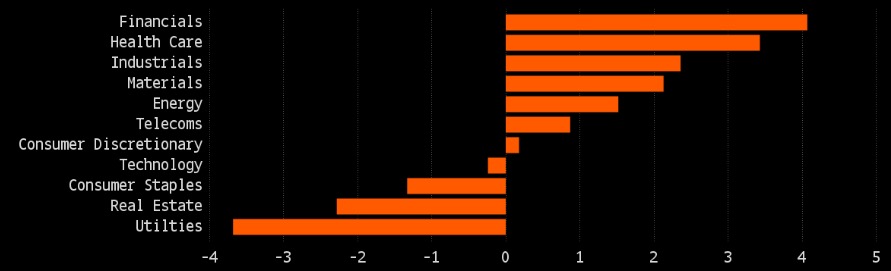
Trader Talk
Single Best Chart – Corporate America is back to making money, and that’s good for stock investors. After back-to-back quarterly earnings declines last year, S&P 500 companies are expected to post robust growth in 2024. Credit goes to strong employment, resilient GDP, steady to lower interest rates and supply chain normalization.
Enjoying the View?
S&P 500 Earnings (YoY)

Special Issue: 44 Picks… 44 Paragraphs
In this special quarterly report I present one paragraph per pick, highlighting why I’m long and what I expect.
Looking To 2024 (Q1)
One Paragraph Per Pick
- Our portfolio of 44 stocks spans six dynamic investment themes offering long-term growth potential
- Stocks have rebounded on expectations of rate cuts and a soft-landing but many remain below 2021 highs
- American Ingenuity prioritizes best-in-breed, high-quality companies poised to lead the new bull market

Focus – Bullseye enters 2024 with a balanced perspective, having posted strong gains in 2023 but declines the year before. I am optimistic looking forward, primarily due to the resilience of earnings and employment, coupled with falling inflation and lower expected interest rates. That said, election-year uncertainty and geo-political instability could create some volatile moments in coming months. Such is the world. Our Bullseye American Ingenuity Portfolio leverages powerful themes that transcend mere headlines. Artificial Intelligence creates an entirely new ecosystem, where Computing Power becomes increasingly important and Core Ingenuity increasingly dominant. Digitization and Logistics reflect changing consumer patterns. Clean Energy faces challenges, but there will still be winners and I think we own a few. Transformative Health is always relevant, as is the evolving process of Normalization. We are balanced and well-positioned as 2024 begins.
American Ingenuity Portfolio
Stocks Grouped Thematically

Clean Energy & Logistics (10)
Aptiv (APTV)
Current $85 / Target $190
Opportunistic purchase of world #1 wiring harnesses manufacturer for electric, autonomous and smart ICE vehicles.
Aptiv leads the world in the manufacturing of wiring harnesses for electric, hybrid electric and advanced gasoline powered vehicles. The company’s unique platform integrates all components of the on-board electrical system, from sensors and semiconductors to the actual wiring itself… like a secondary chassis sitting atop the structural chassis. Chrysler/Dodge, Ford, GM and Volkswagen each account for roughly 10% of Aptiv revenues, and nearly every major automaker in the world relies on Aptiv for at least a portion of its onboard wiring systems. Tesla is the company’s fifth largest customer at 5% of sales. Revenue will likely rise 10-15% this year, driving earnings growth of 25-35%. Shares attractive at 14x 2023 estimates. https://bullseyebrief.com/part-computer-part-car-aptv-issue-208-9-12-22/
Darling Ingredients (DAR)
Current $48 / Target $95
Largest producer of renewable diesel and processor of animal by-products leverages global ESG pivot.
World’s largest publicly traded company producing renewable diesel and processing animal byproducts into both food and fuel. Founded in 1882, Darling processes one out of every seven animals in the world using its network of 270 factories in 22 countries. Non-edible animal parts are rendered into collagen for beauty products, proteins for animal feed, oils for food preparation and feedstocks for renewable fuels. Darling processes two-thirds of N. America’s waste fats and ranks as Europe’s third largest green energy producer. CEO Randall Stuewe anticipates raising guidance again. I think Darling represents a unique opportunity to leverage the global pivot to cleaner fuel and more efficient food production at an attractive P/E of just 10x. https://bullseyebrief.com/green-machine-dar-issue-226-2-6-23/
GXO Logistics, Inc. (GXO)
Current $58 / Target $155
World’s largest contract logistics provider leverages the convergence of Automation, e-Commerce and Outsourcing.
GXO is world’s largest pure-play contract logistics provider, ideally positioned to capitalize on the three mega-trends of Automation, e-Commerce and Outsourcing. With 120k employees in 900 locations, GXO serves thousands of blue-chip clients across nearly every business vertical by managing their inventory, distribution, and even returns… from spare parts at Boeing to extra shoes at Nike. If scale and expertise are the company’s defining attributes, consistency and profitability are its hallmarks. GXO has beaten earnings estimates each quarter since being spun off from XPO Inc. in 2021, by an average of 17%. Guidance is equally compelling. Managment has articulated a pathway to 8-12% topline growth annually through 2027, implying earnings growth of 20-30% YoY and a forward multiple in the high teens. There are very few companies which rank #1 in their field, leverage game-changing mega-trends, provide investors several years of clarity AND trade even with the S&P 500 Index. https://bullseyebrief.com/revolutionizing-supply-chains-gxo-issue-254-9-25-23/
Joby Aviation, Inc. (JOBY)
Current $7 / Target $50
Most advanced, electric-powered heli-taxi creates attractive call option on the future of mobility… Uber of the Skies.
Joby will quickly become the Uber of the Skies, as builder and operator of the world’s most advanced, electric-powered heli-taxis poised to transform short-haul travel. Joby grew out of the $6.5B SPAC created by LinkedIn Co-founder Reed Hoffman and Zynga Founder Mark Pincus. It is the world’s first Electric Vertical Takeoff and Landing (eVTOL) manufacturer to receive FAA certification and US Air Force airworthiness. It’s also the first company to deliver a working eVTOL to the Air Force for actual mission testing. Joby aims to launch commercial service by 2024/5, operating short-haul flights priced similarly to UberX and with the energy efficiency of a Tesla… while cutting travel time by 75% for the typical 25 mile trip. Joby will build and operate its own fleet, initially ferrying travelers between airports and large urban centers like Los Angeles and New York. Management guidance of $2B in revenue by 2025/6 pegs valuation at 1.3x EV/Sales. This is cheap compared to 3.5x for other transformative companies at similarly early stages of their evolution (First Solar, Square, Tesla, Uber). Notably, these companies have traded as high as 11x on average. Toyota, Delta and Intel are all equity partners, collectively owning over 20% of the company. To quote lead investor Reed Hoffman, “My ideal investing is stuff that looks crazy now and in 3-5 years is obvious.” https://bullseyebrief.com/uber-in-the-sky-rtp-issue-137-3-8-21/
MP Materials Corp. (MP)
Current $20 / Target $67
World’s lowest cost producer and only US miner of rare earth minerals for electro-magnets leverages EV adoption.
MP Materials is the world’s lowest cost producer and only US miner of rare earth minerals for electro-magnets and next-generation battery components. These evolving technologies simultaneously increase total output while extending battery life… they also make GE wind turbines more efficient, Tomahawk missiles more accurate and Union Pacific locomotives more powerful. Mineral deposits at the company’s California mine account for 15% the world’s known rare earths reserves and have six times the mineral content of other mines. It’s a strategic asset and a guaranteed source of domestic supply, freeing the US of Chinese dependance. As an environmentally sensitive producer, MP Minerals returns 95% of its tailings to the ground and very little offsite water is used in the mining process. A major capex campaign has entered its third and final phase, resulting in the company being able to mine and refine minerals, as well as produce finished electro-magnets. MP Minerals will be the world’s first and only fully integrated supplier of electro-magnets… and the world’s lowest cost producer. https://bullseyebrief.com/minerals-and-magnets-mp-issue-224-1-23-23/
Prologis, Inc. (PLD)
Current $128 / Target $157
World #1 industrial REIT for high-quality logistics facilities in prime locations at historically low valuation.
Prologis builds and owns the world’s largest network of industrial warehouses adjacent to major city-centers, serving over 6,600 customers across four continents with 1.2 billion square feet… roughly equal to 20,000 football fields. Structured as a REIT, Prologis collects rent from tenants and passes through the majority of net income in the form of dividends, which currently yield 3.4%. Occupancy remains near 97% and lease renewals reflect average price increase of 8%, suggesting Prologis clients see no imminent threat of recession. By contrast, investors have sold shares down to historically low levels. PLD trades at 23 times funds from operation (FFO), compared to an all-time low of 17x and a 10-year average of 25x. While commercial office space faces headwinds due to changing work habits, warehousing demand remains strong, reflecting the tectonic shift to e-commerce and outsourced logistics. Prologis is best-in-breed, cheap, and levered to creating value across the global economy. https://bullseyebrief.com/location-location-location-pld-issue-261-11-20-23/
Symbotic, Inc. (SYM)
Current $44 / Target $75
Robotic warehouse-of-the-future transforms logistics with first-mover advantage and Walmart as a partner.
Symbotic transforms the traditional labor-intensive warehousing business into an automated ballet of AI-powered robots. Because human hands are virtually eliminated from the handling process, customers report efficiency gains of 5-9 times and accuracy rates of 99.99 percent, accompanied by annual cost savings of $10 million per warehouse. Walmart owns 26% of the company and is Symbotic’s largest customer, followed by world #1 wholesale grocer C&S Grocery and world #3 retail supermarket Albertsons. The company has a backlog of $11B projects, which represent five years of development at current rates, though management is quickly scaling its ability to serve these client. Guidance implies top line growth of 50% annually over the next three years, which will result in earnings by 2025 and an implied P/E of 80x 2025 estimates, so it’s no longer cheap… we bought it for $10 less than a year ago. I think some of the price momentum mid-summer reflected a belief that SYM is an artificial intelligence play. It is to an extent, but SYM is attractive as the leading automation solution for large-scale logistics operators. I sold half my position at around the initial $35 target, and remain long with a $75 target on the next tranche. https://bullseyebrief.com/warehouses-of-the-future-sym-issue-218-12-12-22/
Sunnova Energy International, Inc. (NOVA)
Current $14 / Target $66
Leading solar provider with largest installer network leverages the transformative shift to Residential Solarfication.
Sunnova ranks as the nation’s third largest installer/servicer and network operator of residential solar systems, but number one in terms of profitability… no other company comes close to matching its industry-high gross margins of 50%. Sunnova’s regional network of dealers provides flexibility and lower operating costs, while its sophisticated use of tax credits and customer contract securitization generate significant operating leverage. Trading less than two times sales, I think shares could rise significantly. Near-term, emerging sources of poly silicon outside of China will lower input prices. Longer-term, the pivot to residential Solarfication could drive NOVA many turns higher… fewer than 2% of US households rely on self-sufficient solar systems. Management raised guidance several quarters in a row, citing accelerating new customer growth of 150-175k per year, compared to 87k in 2022. Although Sunnova loses money, revenues are growing 35% per year and shares recently traded at their cheapest valuation ever, reflecting the burden of higher rates on businesses which require upfront capital expenditures. As inflation recedes and rates decline, Sunnova should benefit. https://bullseyebrief.com/solar-inflection-point-nova-issue-143-4-19-21/
Uber Technologies, Inc. (UBER)
Current $58 / Target $80
Global leader in shared mobility poised to double revenue and achieve profitability by 2023 as new businesses scale.
Uber operates the world’s largest ride-hailing and food delivery business. There are five things you need to know about Uber… and five reasons why I own it: 1. Scale – Uber is the largest ride-sharing and food delivery business in the world (35-38% share in 63 countries 2. Growth – Uber is the fastest growing large cap Services & Sharing Economy provider (51% vs 30%) 3. Expansion – Uber is leveraging its technology to rapidly develop new businesses (groceries, liquor, freight) 4. Profitability – Uber will be EPS positive all four quarters this year for the first time ever 5. Valuation – Uber trades at a reasonable valuation (2.7 times 2024 estimated sales vs. 2.6x for the S&P 500 but with 10x the growth). Passengers now account for less than half of Uber’s revenue, which I see as a huge positive because there’s no limit to what Uber can carry. Uber trades just below its all-time high in 2021… 2024 breakout candidate? Yes, I think so. https://bullseyebrief.com/reinventing-ridesharing-uber-issue-175-12-13-21/
United Rentals Inc.
Price $550 / Target $650
#1 US equipment rental agency reiterates 20% growth yet trades at historically low valuation on recession concern.
URI is N. America’s largest renter of specialty industrial equipment, with 17% share of this $65B annual market. The company’s fleet of 990k machines at 1,465 locations provides unparalleled opportunity to serve clients in nearly every industry, from construction and infrastructure to energy and manufacturing. URI has posted consistent 25% eps growth and annual revenues hit a record $14.3B in 2023 (up 22% YoY). Management has reiterated a strong outlook for 2024, amid solid GDP growth and an attractive secondary market in which to sell its used equipment…. lower rates will also help financing costs. Like so many cyclical stocks, shares had been punished by recession concerns but are re-inflating. United Rentals is a best in breed operator trading at a below-market multiple despite double-digit growth, with a stellar balance sheet and proven C-suite. As recession fears ebb, I believe URI will continue rising to new highs. https://bullseyebrief.com/take-the-long-view-uri-issue-238-5-15-23/
Computing Power (7)
Axcelis Technologies, Inc. (ACLS)
Current $125 / Target $200
Global #1 supplier of ion implantation equipment essential to semiconductor production leverages current up-cycle.
Axcelis ranks #1 globally at producing equipment which implants silicon wafers with ions, thereby creating the circuits that make computing possible. It’s a billion dollar annual market, and Axcelis has 50% share. The company has raised guidance three times in the past year, and management continues to convey optimism about additional upside. Shares traded through my initial target and I sold half. I am holding the balance with an amended $200 target, about 25x 2024 estimates that imply 20% growth YoY. This is consistent with the stock’s historic multiple. The company’s dominant share, critical relevance to production and rising revenues show no sign of slowing… especially since chip content across industries continues to accelerate at a non-liner rate. Could I raise my target again? Maybe. https://bullseyebrief.com/more-power-please-acls-issue-150-6-7-21/
Dycom Inc. (DY)
Current $112 / Target$145
Leverages rising demand for 5G services and cloud-deployed A.I. by enabling high-speed bandwidth at scale.
Dycom operates as one of the country’s largest specialty contract services providers to the telecommunications infrastructure and utility industries. Active in 49 of 50 states, Dycom designs, installs and maintains arial and buried fiber optic cable systems, copper and coaxial communications networks, cellular towers and base stations, and large-scale electricity generating plants. Demand for Dycom’s specialized products and services is surging, as telecom operators race to upgrade systems for 5G connectivity, cloud computing and now artificial intelligence. Earnings are rising 20-40% annually, but like many companies in the Russell 2000 Small Cap Index, shares trade at less than 15 times earnings due to deflating impact of higher rates. Fine, rate hikes are nearly done and the telecom capex cycle is just beginning. I am happy to own high growth at low valuation, especially in an industry tied to the buildout of artificial intelligence. https://bullseyebrief.com/oversold-but-in-demand-dy-issue-258-10-23-23/
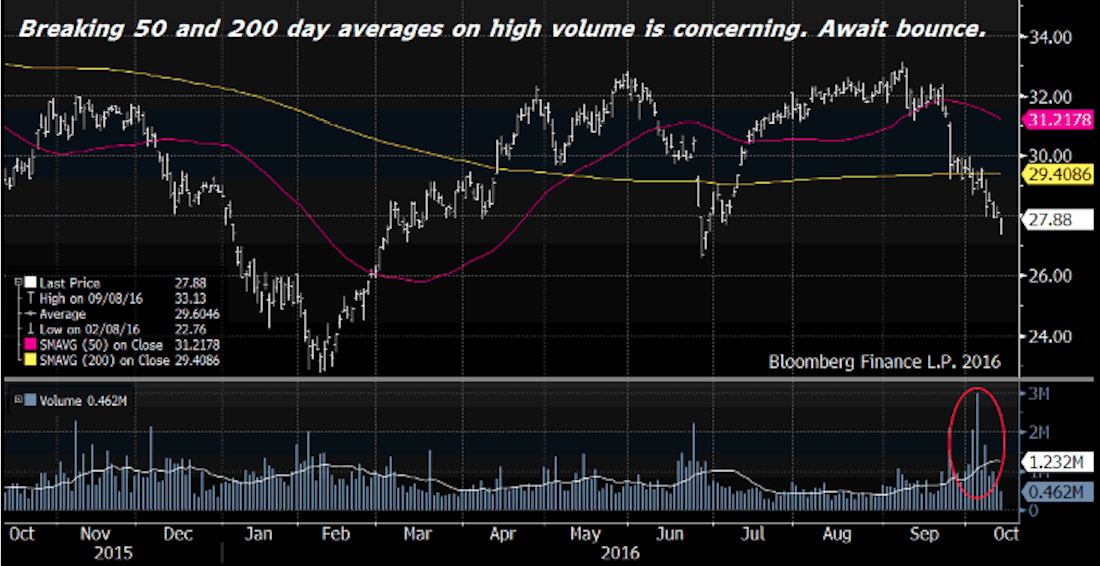
Marvell Technologies, Inc. (MRVL)
Current $56 / Target $92
Marvell advances A.I. by helping companies manage and manipulate vast data sets faster and more reliably.
Marvell delivers semiconductor solutions that move, store, process and secure the world’s data faster and more reliably than competitors. The company’s carrier infrastructure tools link its data centers to large enterprises via 5G, uniting computing speed with cloud flexibility and network scale. As Artificial Intelligence permeates virtually every business, Marvell will increasingly become part of the backbone that enables high-powered computing and real-time analysis. Shares are notoriously volatile, surging on higher earnings guidance and retreating on cyclical tech-sector capex. The stock appears to be troughing near long-term support and I want to begin building a position in anticipation of the next upturn. With AI increasingly essential to business success, and Marvell already integral to AI infrastructure, I expect shares will rally in 2024. https://bullseyebrief.com/leveraging-artificial-intelligence-mrvl-issue-263-mrvl/
Nvidia Corp. (NVDA)
Current $475 / Target $600
Manufacturer of world’s fastest processors leverages mega-trends of AI, EVs, crypto, gaming and the metaverse.
Nvidia is the dominant leader in the design of ultra-high performance semiconductors. It has also become the go-to way to invest in Artificial Intelligence, as designer of the fastest chips in the world. Nvidia’s newest processors are capable of 60 trillion calculations per second, 2x faster than the previous generation and 20x faster than the competition (ResearchGate). If you’ve ever wondered why computer games look so shockingly realistic, where hundreds of 3D images shift simultaneously in realtime, then you’ve experienced Nvidia’s chips in action. Nvidia’s chips have also become essential to the complexity behind cryptocurrency mining, autonomous vehicle operation and augmented reality. Like much of the technology sector, shares fell significantly las year but are on their way back. Revenues are forecast to continue growing 50-60% this year, which makes the stock look cheap at 24 times earnings. The company’s patent-protected chip designs will generate significant earnings growth over the next several years. https://bullseyebrief.com/tech-down-too-much-nvda-issue-181-1-24-22/
NXP Semiconductor, Inc. (NXPI)
Current $210 / Target $300
World #1 automotive and #2 payments chipmaker leverages key themes at reasonable valuation.
NXP ranks #1 globally in the production of auto-related semiconductors, and #2 globally in the production of near-field communications chips. NXP is the sole provider of secure processors enabling ApplePay, and through established supply relationships with Alibaba, Qualcomm and Samsung, NXP appears likely to dominate burgeoning 5G technology as well… a business which IDC estimates will grow 150% annually through 2024. Critically, two-thirds of NXP’s 25k customers actively promote the chipmaker as a strategic partner, placing NXP in the 95th percentile of technology companies with the highest customer satisfaction (Gartner). Last year marked an all-time high for earnings, which analysts expect to decline 10% this year but rebound 10% next year… that’s the generic recession forecast embraced by the Street at the moment. At 14x earnings, shares are slightly below the historical average. I arrive at my $300 by anticipating that the economy avoids recession and NXPI earnings rise 10-20% this year and next. Applying a slightly higher multiple of 16x to 2024 eps of $19 (peers historically trade over 20 times earnings), I arrive at $300. https://bullseyebrief.com/two-themes-one-stock-nxpi-issue-145-5-3-21/
Qualcomm, Inc. (QCOM)
Current $140 / Target $225
Global #1 holder of 5G patents leverages the #1 driver of efficiency and connectivity at attractive valuation.
Qualcomm is the dominant global innovator for 5G technology. The company holds roughly one-third of the world’s patents for advanced semiconductors, chipset designs and communication protocols which enable ultra-fast communication across high-frequency spectrum. Critically, Qualcomm outranks competitors 3-to-1 based on the impact of its patents, according to IEE (Institute of Electrical and Electronics Engineers). Qualcomm’s innovations are so essential that Apple, Ericsson, Huawei, LG Electronics, Samsung and ZTE all pay royalties to incorporate Qualcomm’s defining interoperability standards into their own 5G products. Catalysts abound, including new iPhones which provide global connectivity via satellite thanks to new chips from Qualcomm, accelerating driver-assist opportunities related to the recent Veoneer acquisition, rising handset marketshare from top 5 customer Huawei in China/India, and steady demand increases for Qualcomms RF chips that enable IoT applications like touch-to-pay. Shares trade at 14x forward earnings, well below the S&P 500 Index and its own historic valuation of 21x. Applying an 18x multiple to my 2025 estimate based on 20% annual growth, I arrive at $250. https://bullseyebrief.com/plugging-back-in-qcom-162-9-6-21/
Ultra Clean Technologies (UCTT)
Current $33 / Target $62
Key semiconductor equipment maker trades near record low valuation despite strong macro/micro outlook.
Ultra Clean is a mission-critical company with a differentiated product in a mission-critical sector: Semiconductor manufacturing equipment. The company is the industry’s leading supplier and servicer of highly-controlled, gas-filled chambers where pure silicon wafers can be flawlessly etched into precision semiconductors. The world’s two largest semi cap equipment makers (Applied Materials and Lam Research) are the company’s two largest clients, accounting for 63% of revenues. Other important customers include ASML, Intel and Taiwan Semi. Without Ultra Clean’s vacuum equipment and on-going service agreements, the semiconductor industry would come to a standstill. Revenues and earnings for the entire semi cap equipment sector have come down double-digits, reflecting an industry that completed an up-cycle for new builds in 2022. Reshoring away from China should ignite a new up-cycle in 2024, with many countries scrambling to add capacity. I see growth over the next two years powering a potential doubling in the stock as estimates and multiples reflate. UCTT trades at just 9x 2025 estimates, that’s how much estimates have been slashed… likely a cyclical low. https://bullseyebrief.com/ride-the-rebound-uctt-issue-2017-8-22-22/
Core Ingenuity (6)
Amazon.com, Inc. (AMZN)
Current $145 / Target $215
The seller of everything and dominant online infrastructure operator is too cheap and too essential to ignore.
Amazon excels at nearly every business it enters. The company’s core e-commerce unit is on the cusp of selling more merchandise online than Walmart sells across its entire platform, and its web services division (AWS) commands a market-leading 33% of all cloud infrastructure globally. Though a return to in-person shopping post-Covid knocked earnings down 69%, earnings will recover half the ground as thanks to Amazon Web Services, which doubles every 18-24 months. Amazon shares fell 60% in 2002 and recovered about two-thirds of the loss in 2023. From here, I think shares can nearly double based on a sum-of-the-parts approach to valuation. Specifically, I accept an inline multiple of 13 times 2023 EV/EBITDA on the retail business (77% of revenues) and a premium multiple of 100 times EBITDA on AWS… which is doubling every 18-20 months. This seemingly high EV/EBITDA multiple is actually inline with other SaaS cloud providers. By adding together the two halves of Amazon’s business, I arrive at $215. https://bullseyebrief.com/is-amazon-a-buy-amzn-issue-202-7-18-22/
Facebook/Meta Platforms Inc. (META)
Current $300 / Target $525
Where two billion people connect… The gateway to the metaverse… And not our nanny.
Facebook is like a toll collector at the crossroads of the world, and the only place in the world where 2.2B people gather everyday. Near term, monetization of Instagram is job #1… adding One-Click-to-Pay and taking a percentage of sales for example. Have you noticed more targeted ads btw? That’s another important lever. Longer term, WhatsApp provides signifiant B2C engagement opportunities, especially in light of the recently announced partnership with Meta to provide/expand B2C engagement for businesses large and small. One year ago I would have called the metaverse a call option. Now I call it an increasingly irrelevant experiment and that’s fine. Mr. Zuckerberg learned his lesson and returned to prioritizing cashflow, driving shares into the $300s from $80. Meta has historically traded at 25 times earnings. Applying this multiple to my 2025 estimate (20% annual eps growth) yields a target of $525. https://bullseyebrief.com/the-big-six-aapl-amzn-fb-googl-msft-nvda-issue-167-10-11-21/
Google/Alphabet Inc. (GOOGL)
Current $140 / $210
Buying one of the world’s Biggest/Best companies down 25% at 20 times earnings with 18% growth… keep it simple.
Alphabet/Google Inc. completely dominates the digital landscape, ranking #1 globally in Search and Advertising with 92% and 28% marketshare respectively. No other company touches more people every day than Google, and despite its size, profits rise double-digits year after year. In the pantheon of World’s Best Companies, Google stands apart. Incredibly, the stock has fallen 40% from its high and now trades at just 20 times earnings, compared to 29 times over the past decade. I think the world’s third largest and second fastest growing mega-cap deserves a premium valuation. It’s also an excellent business I want to own. Expanding connectivity and perpetual population growth provide ample runway for Google revenues to continue rising, while its ground-breaking Labs subsidiary creates optionality on new technologies like artificial intelligence, drone delivery and autonomous service vehicles. Google is high quality, highly profitable and highly attractive at current valuation. https://bullseyebrief.com/keep-it-simple-googl-issue-194-5-9-22/
Microsoft Corp. (MSFT)
Current $370 / Target $450
World’s 2nd largest tech company trading 40% off its high at lowest valuation in 5 years despite double-digit growth.
Microsoft is the world’s second largest company by market cap behind Apple. You may think of Microsoft as the operating system loaded onto your PC from the 90s, but today it’s so much more. Cloud-enabled software now accounts for about half of revenues, while legacy Windows installations on individual machines represent only about a tenth of the business. The company’s ground-breaking Azure product provides an entire ecosystem in the cloud, so large enterprises can run everything remotely. Microsoft’s portfolio also includes LinkedIn, Halo gaming and Bing search. Its partial ownership of ChatGPT creates an interesting call option on artificial intelligence. Microsoft guidance implies double-digit eps growth, well ahead of Gartner’s forecast for 5% IT capex increases this year. Against this positive backdrop, shares recently rebounded from their cheapest valuation in five years. Buying at that point was easy. Buying today is logical. https://bullseyebrief.com/big-but-unloved-msft-issue-216-11-14-22/
Palo Alto Software, Inc. (PANW)
Current $284 / Target $350
Best-in-Breed full-service cybersecurity platform offers steady upside in an increasingly must-own sector.
Palo Alto builds comprehensive, AI-enhanced security platforms to protect enterprise-wide networks for 85,000 customers globally. It’s the top-ranked, fastest growing and largest network security provider in the world, having recently eclipsed Cisco Networks by marketshare. Israeli-American engineer Nir Zuk (formerly of CheckPoint) founded the company in 2005 to enable interoperability of multiple applications within a secure environment, an important innovation for the industry and key reason why Palo Alto has grown so quickly. Rather than simply restricting access and siloing specific tasks, as had been the standard approach, Palo Alto distinguishes itself by creating protocols which enable secure connection between all trusted parties across unlimited operating applications. The company has beaten earnings estimates every quarter since going public in 2012 (by 10.7% on average), and 2024 could mark the eleventh consecutive year of 20-30% topline growth. Shares are not cheap at 45x forward earnings, but no other cybersecurity company matches Palo Alto’s growth at scale. My target of $350 reflects $7 in eps multiplied by a 50x P/E… my multiple may sound high, but I think my earnings estimate could prove low. https://bullseyebrief.com/protecting-the-perimeter-panw-issue-205-8-8-22/
Salesforce.com (CRM)
Current $250 / Target $325
Tactically buying the world’s first, largest and top-ranked customer relationship management software provider.
Salesforce is the world’s first and largest customer relationship management software provider, ranked #1 globally for the eighth consecutive year by IDC. The firm’s 24% market share is so dominant that it exceeds the next four closest competitors combined (Adobe, Microsoft, Oracle and SAP). Salesforce succeeds by giving its users a customizable and integrated platform that tracks every aspect of their clients’ experiences, ultimately improving service and driving sales. Salesforce says that 72% of customers using more than one of its apps report faster ROI, and 95% report improved efficiency and productivity as well. Revenue had risen 20-25% consistently, but slowed to 10% last year… leading to layoffs, a restructuring and the arrival of five activist funds. The strategy has worked. Growth appears back on track and Wall Street is reengaged with CEO/Founder Marc Benioff. Shares have doubled from the low. I arrive at my $325 price target by averaging calculated upside under four scenarios: Peer valuation, historic multiple, discounted cash flow, M&A precedent. https://bullseyebrief.com/know-your-customer-crm-issue-192-4-25-22/
Digitization (6)
Block Inc. (SQ)
Current $70 / Target $200
Top-tier B2C and C2C payments provider growing double digits offers significant runway for growth at low valuation.
Block Inc., formerly known as Square, operates two fast growing businesses: Payments processing for merchants (Seller) and money management for people (CashApp). You’ve probably seen Square’s little white device that turns an iPhone into a cash register, but it’s more than that… real-time sales data feeds inventory replenishment, payroll, etc. The consumer-facing side of the business is giving PayPal a run for its money, and there are significant synergies between the two operating units. The company recently reported results that nearly doubled the estimates, which speaks to how negative sentiment has gotten across the sector. Management sees Seller gross profits tracking +50% and CashApp gross profits tracking +20%. The stock was down 80% from its high, has regained some of its lost ground but still trades at just 1.7x sales, compared to an average of 7.5x over the past five years. Last year, short-seller Hindenburg Research asserted that as many as one third of the payments accounts were fraudulent and the platform had become a money transfer mechanism for drug dealers. The stock initially declined 20% but recovered. The analyst community debunked the report across the board. Large institutional investor have bought shares and management has followed up with several better than expected quarterly results. https://bullseyebrief.com/growth-meets-value-sq-issue-186-3-14-22/
Coinbase International Inc. (COIN)
Current $150 / Target $200
First and most comprehensive crypto platform becoming industry backbone as institutional adoption accelerates.
What a difference a year makes: from the SEC suing the company for failing to meet vague securities regulations, to lawmakers criticizing the SEC for a baseless lawsuit. With the stock now up 500% from the low, Coinbase has established itself as one of the top three global cryptocurrency platforms, providing fully-integrated trading and transfer as well as secure custody and wallet services. Coinbase has partnered with BlackRock, the world’s largest asset manager, to offer full prime brokerage and custody services for crypto to the firm’s largest institutional clients. The company was founded six years ago and has developed proprietary operating systems which would be extremely hard to replicate. In the same way that Amazon created AWS and now dominates internet transactions, Coinbase has created software and transactional protocols used by customers and competitors alike. The company’s profitability fluctuates with the value of bitcoin, since commissions are calculated as a percentage of gross dollar volume. Any increase in bitcoin is therefore a positive. Additionally, custody services will increasingly provide bank-like earnings visibility, and the company is working with regulators to insure integrity of the overall ecosystem. Again, a positive. The company has $5B of cash on the balance sheet. My target of $200 reflects a scenario, where bitcoin averages $40-50k over a 12 month period and annual revenues re-inflate to $7B from $3B. https://bullseyebrief.com/crypto-cornerstonecoin-issue-149-may-25-2021/
Expedia Inc. (EXPE)
Current $145 / Target $265
Top US travel aggregator pummeled by market selloff despite strong earnings/guidance presents tactical opportunity.
Expedia is the largest US online travel agency/aggregator, generating over $125B in annual bookings through fourteen platforms which include Hotels.com, Orbitz, VRBO and namesake Expedia among others. Revenue is on track hit another new all-time high this year, as consumers appear eager to spend record amounts on travel and leisure. Critically, average daily room rates at US hotels are 10% higher than before Covid, and air traffic risen to all-time highs. While Expedia’s promotional spending has been higher than in years past, trends are normalizing and management has joined Delta Air Lines in raising guidance twice in six months. At just 12 times earnings, Expedia trades cheaper than the S&P 500 Index, despite 40% eps growth. Expedia represents a compelling opportunity, especially as investors realize recession is unlikely and the AI rally broadens out. https://bullseyebrief.com/irrational-opportunity-expe-issue-198-6-6-22/
SoFi Technologies, Inc. (SOFI)
Current $8 / Target $25
Best managed neo-bank targeting Millennials and GenX borrowers with strong credit and rising financial needs.
SoFi provides a complete suite of financial services on a single app, including cash management, checking, savings, trading, credit cards, loans, loan refinancing and investment advice. SoFi’s 2.5M customers are predominantly Millennials and GenXers with strong credit, who consider themselves digitally native and seek complete control of their finances from a trusted mobile device. Critically, these aspirational consumers rely on SoFi for multiple products, creating a powerful flywheel effect which drives margin expansion and topline growth. Sofi also operates a third-party payments and processing platform called Galileo, licensing its software to other online banks in much the same way Amazon Web Services facilitates digital commerce for other retailers. Anticipated revenues of $2.5B this year represent 25% growth and enable full-year profitability for the first time in company history. Last year the company received its banks charter, which has dramatically lowered its funding costs by enabling deposits in lie of stock/bond offerings. Managment is highly pedigreed and appears to have the goodwill of Wall Street, a noted positive for a relatively new public company. CEO Anthony Noto buys significant amounts of stock in the open market nearly every month, and is now the company’s 17th largest shareholder. https://bullseyebrief.com/get-your-money-right-sofi-issue-168-10-18-21/
Unity Software, Inc. (U)
Current $40 / Target $100
Global #1 provider of 3D immersive gaming software leverages the mega-trend of metaverse digitization.
Unity ranks #1 globally as the only publicly traded pure-play platform enabling the creation and operation of interactive, real-time 3D content (RT3D). Over 70% of the world’s top 1,000 mobile games are made exclusively using Unity software, and nearly 2.6B people engage monthly within Unity environments. At the design stage, the company’s unique tools empower game developers, building architects, automotive designers, and filmmakers to bring complex creations to life. Once operational, Unity’s platform provides a comprehensive set of solutions to implement and monetize immersive content across mobile phones, tablets, PCs, consoles, augmented and virtual reality devices. Revenues are growing 40-50% YoY and are on target to surpass $2B this year, which sets the stage for a doubling of earnings and first-ever year of after-tax profitability. Despite this success, shares have fallen 80% from the all-time high in 2021, and management must prove its new pricing structure will drive profitability without alienating developers. My target implies a 12x multiple on 2025 sales of $3B. https://bullseyebrief.com/software-for-tomorrow-u-issue-174-12-6-21/
The Walt Disney Company
Current $93 / Target $160
Global #2 tourist attraction operator and US #2 media content platform trading at a discount on multiple metrics.
Disney is the world’s second largest tourist attraction operator behind the National Parks Service, and the country’s second largest media content and distribution platform behind Comcast/NBC Universal. Two-thirds of sales are driven by the company’s digital platforms, in a world increasing relying on digitization to drive commerce. Disney turns 100 this year and will make more money than ever before, potentially posting a third consecutive year of double-digit growth. Curiously, the company had an opportunity to sell ABC for $10B via two unsolicited offers and refused… the market knows these assets are too cheap, with the stock having lost half its value. Newly returned CEO Bob Iger told reporters that Disney had gotten away from story-telling, focusing too much on messaging and I agree. Get back to creating great content, and then distributing that content over a multi-faceted platform (Movies, TV, Networks, Hulu Digital and via merchandise). Six of the top 10 shareholders have added to positions, as have insiders. Every time DIS stock descends below $100, buyers emerge. This is a top global franchise with multiple businesses, repositioning for growth under a proven leader, and the stock is historically cheap. https://bullseyebrief.com/100-years-of-innovation-dis-issue-235-4-17-23/
Normalization (12)
Alexandria Real Estate Equities Inc. (ARE)
Current $125 / Target $235
Largest and only pure-play REIT serving specialty life-sciences tenants offers high cash flow and stable growth.
Alexandria Real Estate is the largest and longest-tenured owner/developer of specialized AAA commercial space focused exclusively on meeting the unique needs of the life sciences sector. For investors this translates into a compelling combination of high cash flow, stable dividend income and consistent earnings growth. From fully-wired, high-tech workspaces to customized laboratories housing billions of cutting edge equipment across corporate campuses, Alexandria owns 74M square feet in North America and has 6M additional sq ft under development. Future commitments already in planning total another 17M sq ft and provide significant runway for growth. The company’s uniquely focused business model ensures a high-quality tenant base, resulting in higher occupancy, longer leases, stronger cash flow and industry-leading capital appreciation. Notably, current occupancy is 96% and lease renewals are being signed at 6% increases, both of which provide ample support for the 4.5% dividend yield. Ironically, shares trade at a 25% discount to long-term valuation on the assumption all commercial real estate is doomed by higher rates and work from home demographics. I disagree, and I think the current valuation anomaly will correct as stability returns to the market. Buying Alexandria now provides a rare opportunity to acquire an investment-grade company at a near-distressed valuation. https://bullseyebrief.com/backdoor-bet-on-biotech-are-issue-206-8-15-22/
Bank of America (BAC)
Current $34 / Target $43
Large money center bank at historically low valuation amid broader selloff offers entry point for tactical investors.
The benchmark KBW Bank Index representing the nation’s 22 largest lenders fell 35% in just one week last March, and while I could probably make a case for several constituents, I bought BofA for its safety, upside and a dividend. The bank has twice as many deposits as loans, which is very conservative. Additionally, the bank could come up with $555B in cash if it needed to, and could secure another $632B in loans from the FDIC for a total $1.1T, which is more than half its deposits. So even if half the depositors wanted their money back, BofA could comply. And the absurdity of that notion is that BofA is the bank where people go for safety, not the other way around! As a direct result of Silicon Vally Bank closing its doors last year, BofA saw inflows of $15B in three days. BofA’s fortress balance sheet makes it a safe haven of choice. BofA’s profits are steady, and shares trade at book value. Historically, BAC trades at 1.7x book value. It’s cheap and it also yields 2.7%. This is one one own and forget about. https://bullseyebrief.com/danger-or-opportunity-bac-issue-231-3-20-23/
Blackstone Inc. (BX)
Current $123 / Target $200
World’s largest alternative asset manager leverages scale and brand as rates rise and the economy strengthens.
Blackstone is the undisputed private equity leader, and the stock’s 50% decline amid market volatility has provided an attractive entry point… BX is a stock to buy on pullbacks because it generally recovers faster than the market. Blackstone is a money machine, the largest and fastest growing alternative asset manager in the world. The company earns fees by managing client assets and capturing profits when it invests its own capital, typically alongside clients. Profits have topped analyst estimates by an average of 25% in five of the last ten quarters, though high rates have pressured exit multiples and kept earnings flat-ish. That said, lower expected rates this year should provide buoyancy. BX typically trades at 30-35 times earnings, and currently it’s at 23x. As the dominant operator in a business defined by legendary founder Steve Schwarzman, Blackstone should probably be a core holding. https://bullseyebrief.com/money-machine-bx-issue-179-1-10-22/
Boeing Company (BA)
Current $245 / Target $300
Eye of the storm for the long-awaited rebound from lockdowns and lingering concerns around airworthiness.
Boeing is coming back from the dual crises of Covid and the 737 MAX grounding as a stronger, more focused business with a rapidly improving outlook. New orders for the 737 MAX exceed 800, and total backlog is the highest in Boeing’s history. All 450 airplanes which had been stockpiled during Covid found buyers last year, resulting in $9B of much needed cash flow. Boeing’s journey to improved fiscal health and better public perception is taking time, but markets always look forward and I see runway ahead. Quality-control issues which impacted the 787 Dreamliner have been settled, and voluntary lay-offs last year have given way to new rounds of hiring this year. Notably, the military business represents 35% of revenue and continues to generate stable cashflow. My $300 target reflects 25 times more normalized earnings of $12, which compares to $18 in 2018 and an all-time high of $450. https://bullseyebrief.com/ready-for-takeoff-ba-issue-112-8-17-20/
Boston Properties, Inc. (BXP)
Current $59 / Target $140
Premier owner/operator/developer of Class A office space will earn 17% more than in 2019 yet trades 25% cheaper.
Boston Properties is the nation’s largest office REIT and the standard by which all other real estate development businesses are judged. The company owns 195 of the highest quality buildings, leased to the most established corporate tenants, at the best locations in just five winning cities: Boston, Los Angeles, New York, San Francisco and Washington DC. New projects happen only if two-thirds of the space can be pre-leased to strong anchor tenants, ensuring development costs are fully-funded, and Boston Properties has never reported an annual loss… not even in 2009. Throughout Covid, the company collected 98% of rents due from office tenants, and 94% from retail tenants. Multiple lease renewals being negotiated currently (at higher rents) will lift occupancy from 90% to 92%… which compares to an all-time high of 94% pre-Covid. Shares trade at a wide discount to long-term valuation (9x P/FFO vs 21x) and yield 5.7%. https://bullseyebrief.com/back-to-the-office-bxp-issue-114-sep-14-2020/
Charles Schwab Corp. (SCHW)
Current $67 / Target $95
Fear of contagion in the banking sector creates a unique moment to buy the nation’s largest stock brokerage.
Charles Schwab is the largest US stock brokerage firm and twice the size of its next closest competitor, with $7.5 trillion under management across 33 million accounts. The company also operates as a well-capitalized and sizable bank, at $460B in deposits and $40B in loans. As regulators forced several regional banks to close their doors in last year, Schwab attracted $17B in new assets looking for a home. This vote of confidence by nervous depositors sent a strong signal to potential investors about Schwab as a beacon of trust. I see four reasons to buy shares of Charles Schwab now: Customers are bringing new money onto the platform; Structural changes which created the selloff have reversed; Insiders are buying; The stock is historically cheap. Not long ago, SCHW’s price to earnings multiple traded lower than at the Covid low, and that was the lowest since the financial crisis. This institution is too high quality to trade a multi-decade valuation low, and I think the stock is a buy. https://bullseyebrief.com/quality-trust-value-schw-issue-232-3-27-23/
Chubb Ltd.
Current $227 / Target $290
World’s largest and most profitable P&C insurer trades at single-digit valuation despite double-digit growth.
Top-ranked insurance company operates in 54 countries and manages $200B in assets. Recognized for its “no questions asked” approach to paying claims, Chubb charges more but earns more by astutely investing incremental premiums to generate superior returns for shareholders. The company is also adept at managing costs, with a consistently lower combined ratio than peers. Critically, recent quarterly results demonstrated strong pricing power, prompting analysts to raise earnings growth estimates to 26% YoY. At a P/E of 12x, Chubb trades at a 25% discount to its 10-year average. That’s rare for a blue chip like Chubb, especially with book value accelerating as maturing assets get reinvested at 5% vs. 3% in 2022. https://bullseyebrief.com/this-ones-still-cheap-issue-245-cb-7-10-23/
Delta Air Lines, Inc. (DAL)
Current $39 / Target $68
Top airline defined by superior fundamentals and relentless innovation leverages no-recession scenario at low P/E.
Delta is the strongest full-service US operator (highest margins, most innovative, best balance sheet), and the only airline I’ve ever owned. While airlines are a notoriously tricky business, Delta CEO Ed Bastian is an exceptional leader, adept at trimming the aircraft for maximum efficiency at speed. In additional to industry-leading fare segmentation that maximizes profits in the cabin (eg paying extra for an aisle, checked bag, early seat assignment, etc.), Delta’s frequent flyer program with Amex and its third-party maintenance services with other carriers generate hundreds of millions as standalone businesses. Additionally, the company’s oil refining subsidiary provides a unique hedge in the industry against record fuel prices. Before Covid, Delta was the industry’s most profitable airline, and since Covid, the company has fortified its balance sheet with the most amount of cash. Delta trades at just 6 times earnings. That’s absurd. https://bullseyebrief.com/ready-for-takeoff-again-dal-issue-199-6-20-22/
Ford Motor Company
Current $13 / Target $25
Well-known industrial levered to EV acceleration also generates significant income at historically attractive valuation.
Ford ties General Motors as the largest US automaker by sales, and the two rank third globally behind Toyota and Volkswagen. The company pioneered mass production in 1902, never took government assistance in 2009 and wants to become the #1 EV producer in America by 2026. EVs represent a compelling opportunity to turbocharge profitability, with 2-3 times the margins of gasoline-powered engines given fewer moving parts and faster automated assembly. While EV estimates have been tempered, the EV boost to profitability is still notable. Ford stock trades near one-year lows at just 6.5 time earnings and yields 5%. As the market moves past its preoccupation with rates and recession, I think the stock will bounce from its current area of support and could ultimately double. As for last year’s settlement with the UAW, labor costs represent just 8-10% of an automobile’s cost and Ford can easily recover the added $700 per vehicle by raising prices. https://bullseyebrief.com/three-themes-one-stock-f-issue-239-5-29-23/
Korn Ferry, Inc. (KFY)
Current $55 / Target $83
Top-ranked executive search firm creates call option on growth having already discounted recession at 10-yr low P/E.
Korn Ferry consistently ranks at or near the top of Forbes’ global ranking of Largest and Most Influential Executive Search Firms. Operating 100 offices in 55 countries, Korn Ferry places executives and advices boards on strategic decisions, making it an indispensable partner where 90% of annual billings constitute repeat business. Revenues have hovered near $2.8B for two years, but I think growth will resume in 2024 as companies pivot from trimming to hiring. Additionally, while executive search accounts for the over half firm-wide revenue, management consulting services and data analytics are increasingly playing a bigger role in profitability, widening the moat around KFY’s value-added services to clients. Anticipating recession last year, investors sold shares from all-time highs to their cheapest valuation in ten years. Korn Ferry is a world-class franchise offering considerable value, especially if the economy avoids recession as I believe. https://bullseyebrief.com/king-makers-head-hunters-kfy-issue-217-12-5-22/
Visteon Corp. (VC)
Current $116 / Target $195
Top electronics supplier to auto industry at historically low valuation despite UAW resolution and strong growth.
Visteon is the auto industry’s digital cockpit leader, replacing traditional dashboards covered by gauges and buttons with fully integrated electronic displays that include driving information, navigation screens, climate controls and infotainment systems. The company is also an electric vehicle pioneer, providing auto OEMs with multiple systems that maximize battery performance and optimize charging. Earnings are growing 25-35% and the balance sheet is strong, but shares trade at an historically low valuation of just 12.5 times forward earning, reflecting lingering concerns over recession and the UAW strike. As these issues dissipate, I believe valuation will rerate to a more normalized level. Visteon exemplifies American Ingenuity and offers a compelling combo of growth and value. https://bullseyebrief.com/bargain-hunting-vc-issue-262-12-4-23/
Wynn Resorts, Limited (WYNN)
Current $94 / Target $183
Down 60% from pre-Covid high with revenues down just 20% and the $100M online betting platform coming online.
Wynn Resorts operates six premier hotel/casinos serving the VIP gaming and entertainment market across the US and China. In addition to its signature Wynn and Encore properties in Las Vegas, the company operates a stunning new hotel/casino on Boston Harbor, and three stellar destination resorts in Macau. Three of its six properties rank 1, 2 and 3 on Forbes Global list of largest and most comprehensive 5-star resorts, while Trip Advisor consistently rates Wynn Las Vegas the number one destination casino in the US. Business imploded during Covid but has come roaring back. The company’s Las Vegas properties are sold out nearly every weekend, and China’s Macau is seeing volumes rise dramatically. Longer term, the company is developing a new destination resort in Abu Dhabi and pursuing a potential first-ever gaming license in New York City. Earnings are expected to rise 165% this year and 65% next year. https://bullseyebrief.com/betting-on-a-vaccine-vegas-wynn-issue-118-10-19-20/
Transformative Health (3)
CVS Health Corp. (CVS)
Current $81 / Target $132
Healthcare leader and sixth largest US company by sales trading at record low valuation despite solid growth/outlook.
CVS has grown into the nation’s sixth largest company by sales, a $340B per year healthcare platform providing health insurance, specialty benefits, walk-in clinics, in-home treatment, preventative care and retail pharmacies. Through a series of transformative mergers over several years, management has successfully expanded from narrow retailer to full-service provider, while generating consistent earnings growth year after year. Incredibly, the stock trades at just 9 times earnings, less than half the multiple of the S&P 500 and its cheapest valuation in 20 years… even cheaper than during the Covid plunge of 2020. By comparison, United Health Group trades at 22x earnings. I think the discount reflects market perception of a less focused enterprise, and one which needs to prove it can integrate $17B of new acquisitions closed in 2023. Fair point, but I’ll happily buy a market leader trading on the cheap, especially in light of consistent growth, proven C-suite and 3% dividend yield. https://bullseyebrief.com/take-the-long-view-cvs-issue-237-5-8-23/
Progyny Inc. (PGNY)
Current $36 / Target $88
Leading assisted pregnancy provider could see its addressable market rise severalfold over several years.
Progeny produces 30% more successful pregnancies than competitors at three-quarters the cost, and ranks #1 by market share in this rapidly expanding business. Originally launched in 2008 as a research platform to help women navigate the myriad of decisions and procedures associated with infertility and pregnancy, Progeny has since expanded to provide full counseling, pharmacy benefits and even concierge services across the entire fertility journey from egg harvesting to childbirth. Companies hire Progeny to match employees with doctors and procedures based upon AI-assisted pre-screening data, and the results are stellar. Progeny’s track record of healthy pregnancies is nearly double the national average, which is likely to drive +100% customer enrollment growth and 30-50% annual revenue growth for the fourth straight year. My target of $88 reflects a 40x multiple on 2025 eps of $2.250. Why 40x? because that’s double the S&P 500, with earnings growth of 4-5x the S&P 500. Arguably, my target is conservative. https://bullseyebrief.com/were-having-a-baby-pgny-issue-187-3-21-22/
Rapt Therapeutics (RAPT)
Current $23 / Target $60
Unique approach to modulating the immune system up to fight cancer or down to minimize allergy could be a takeout.
Rapt rocketed from $18 to as high as $50 in 2020 on strong data in its Phase I trial to treat atopic dermatitis (AD), and has since traded several times between $15 and $30 on the precarious funding environment which has enveloped biotechnology. Focusing on the data, patients with moderate-to-severe AD who received Rapt’s RPT193 showed a 36% improvement from baseline in the Eczema Area and Severity Index (EASI) score, compared to 17% in the placebo group. Notably, after six weeks, that margin widened to 53%, versus 9% in the placebo group. The stock recently declined on news the follow-on Phase II trial will take longer than expected to report results,… mid-2024 vs. year end 2023. Separately, This same drug is being tested in a Phase II trial to treat asthma which just began in March 2023. Rapt’s other drug candidate (FLX475) is in Phase II trials to treat cancer, blocking the migration of regulatory T-cells to tumors that would otherwise help tumors disguise themselves as healthy tissue. While seemingly very different, allergic response and cancer defense are related immunological mechanisms. RAPT’s unique approach modulates the singular cellular receptor responsible for both inflammatory response and cancer-fighting capability, tuning it up or down as needed. Rapt is an innovative company with a highly differentiated approach that could make it appealing as an acquisition once capital markets normalize Critically, it’s also well capitalized to fund development, with $250M in cash as of 12/31/22. https://bullseyebrief.com/biotechs-cutting-edge-rapt-issue-96-2-feb-17-2020/ ![]()


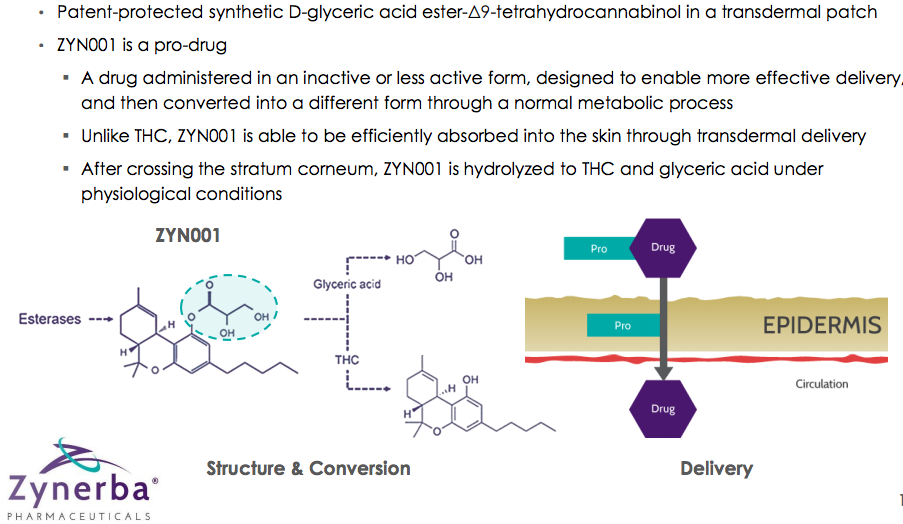
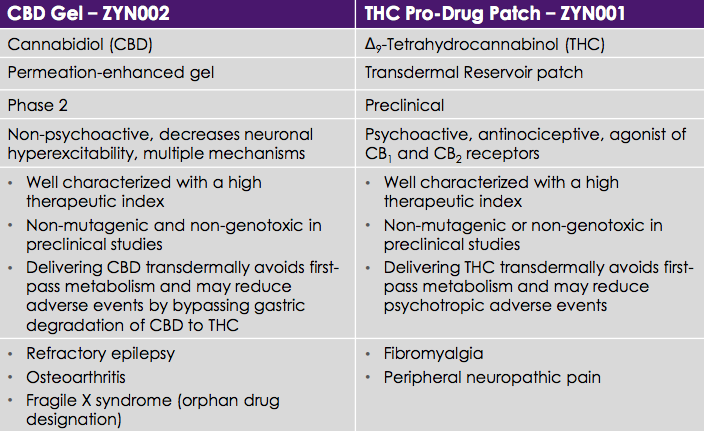
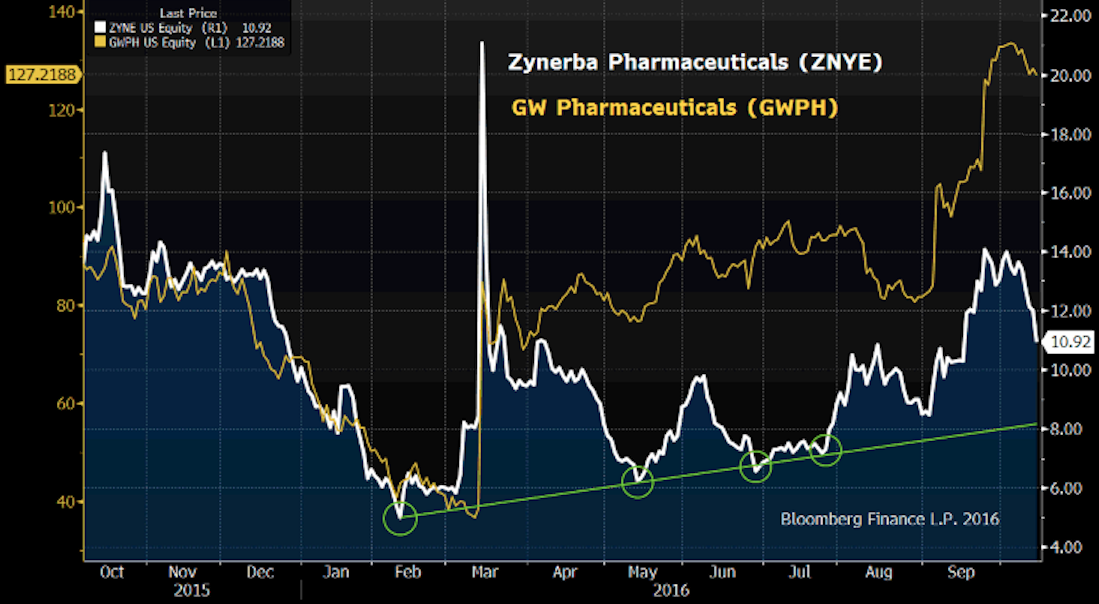
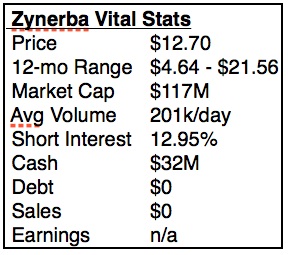
 Zynerba Pharmaceuticals (ZYNE) has been getting a lot of attention recently, more than most companies valued at just $132M. Its two patented compounds are synthetic versions of the pain-suppressing, anti-inflammatory chemicals which appear naturally in marijuana, and unlike competitors, Zynerba has figured out how to transmit them through the skin, avoiding many of the side effects associated with oral ingestion by regulating chemical flow more evenly. Its 5 independent Phase II trials are fully funded through 2017, and Zynerba owns its two proprietary compounds outright, with patent protection for 14 years.