Separation Anxiety (Issue #10.3 – 8/5/16)

Separation Anxiety

Miners Too Far Ahead of Gold

  • Mining stocks have rallied five times more than gold year-to-date
  • Incremental gold demand in 2016 has been driven largely by flows into exchange traded funds
  • Poor profitability among mining companies undermines current valuation
  • Options market offers attractive ways to establish short exposure

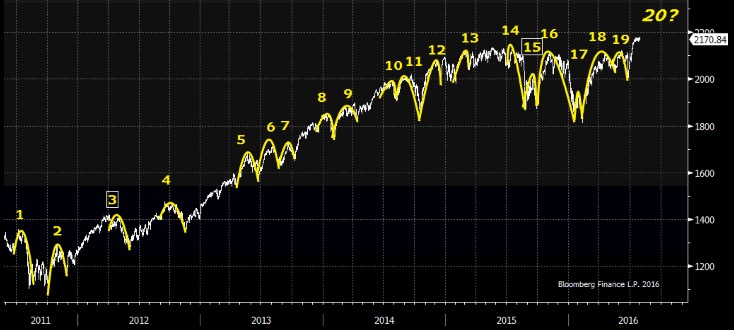
Anyone who bought gold mining stocks at the beginning of the year is a hero. The big companies like Newmont (NEM) and Barrick (ABX) are up 127% on average. The smaller takeout candidates, often called the junior miners are up even more –about 165%. No other sector even approaches triple digit returns this year. Granted, the sector peaked in 2011, so investors have had to wait five years for redemption. In addition, many of the miners still sit well below all-time highs, but this year’s windfall feels pretty good. The operative question at this point: How far will they go, or how long will this last?

Newmont Mining CEO Gary Goldberg took a stab at providing an answer during the company’s 2Q earnings call on July 20. As you might expect, he’s bullish.

“Low or even negative real interest rates are making gold an increasingly attractive investment. Concerns about slower global economic growth and weaker domestic employment have forced the Fed to be more cautious about raising interest rates. The markets now anticipate no or at most one rate hike in 2016. Inflation is also trending upward. We’re seeing more money flowing into gold on the back of these trends… global ETF gold holdings have increased by more than 17 million ounces or nearly 40%.”

SA2
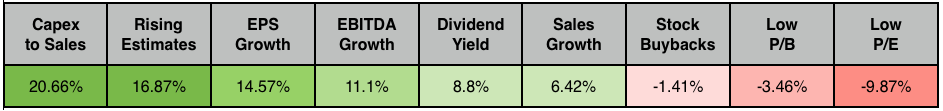
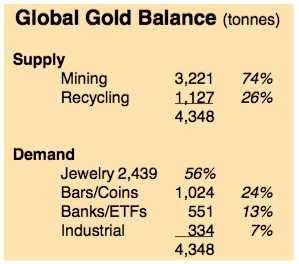
Mr. Goldberg is correct about the surge in demand from financial buyers, most notably by administrators of exchange traded funds needing to purchase gold in order to issue more units against investor inflows. You can see financial buying accounted for about 13% of demand in 2015, much of which came from central bankers, whereas this year it’s all about the ETF, 336 tonnes worth of buying in Q1. (The supply/demand balance tends to vary by about 10% from year to year, based on demand tracked by Bloomberg from the World Gold Council.) Incremental demand so far in 2016 has been enough to drive the price of gold 28% higher. It’s impressive, but there’s also a disconnect… the mining stocks are up 5 times more. I recognize they have operating leverage… but 5x?

Conscious Uncoupling
FullSizeRender-34

In fairness, companies like Newmont Mining have been particularly adept and lowering costs and paying down debt during the four year gold implosion which haunted them from 2011 to 2015. They’ve shuttered marginal mines and generally brought all-in sustaining costs (AISC) down to $700-800/oz from well over $1,000/oz. In the case of Barrick Gold, net debt has fallen from $10.4B in 2014 to about $7.5B currently. Overall, mining companies have done a good job retooling their businesses to prepare for leaner times, realizing like so many others $2,000 gold wasn’t the slam-dunk markets had assumed.

It’s a very different scene from 2010, when I interviewed then-Newmont CEO Richard O’Brien at the BMO Metals & Mining Conference for Bloomberg Television. He had just wound down the last of Newmont’s hedges (impeccably timed) and proudly announced he did so because investors told him they wanted exposure to gold, not financial wizardry. They certainly got it… albeit in a different way.

Here’s the thing about gold investors: When they buy, they think gold is going to make them rich. It’s not about double-digit earnings growth or cheap NAV, it’s about runaway inflation or the end of fiat currency and only gold will protect them. $2,000 gold? More like $10,000 gold. Take a look at the metrics for the three largest mining companies in the ever popular VanEck Gold Miners ETF (GDX), whose daily average volume of 73M shares makes it one of the most active equity securities in the world.

You Want to Own These?

Q1 Profit Metrics
SA4

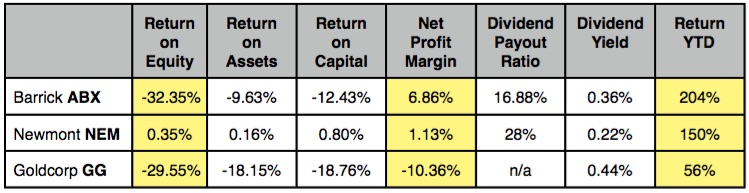
The profitability metrics on these companies are AWFUL, and by the way there’s no dividend to speak of because there are virtually no earnings. Obviously investors see something else… I love Goooooooooold.

Okay, I admit an average price to book ratio of 2.09 for the miners in the GDX and 1.96 for the smaller companies in the GDXJ is not unreasonable. It’s neither rich relative to the S&P 500 Index nor to the historical range for the sector. In addition, I fully recognize the appeal of gold against the backdrop of rising sovereign debt due to global money printing by central banks. I will also grant that all this money printing may one day stoke inflation, against which gold should provide a hedge. Fine.

But let me say this: I do not want to own marginally profitable mining companies already up 150-200% YTD on the “hope” gold rallies further. In fact, I want to short them, and the analyst community would appear to agree. Many of the stocks within the GDX and GDXJ are trading at/near consensus targets. They’ve had their run and it’s time to sell. Here’s how we do this:

1. Buy puts on the GDXJ funded by selling calls. I like Sep 50 puts vs Sep 53 calls at even money (both $2.80) with the index at $51.00. This combo give us a little cushion and costs nothing initially.

2. Buy long-dated GDX Nov 29 puts for $1.90 and forget about them. The index is at $31.25 so the breakeven is -12.58% and if the miners break, this option will accelerate quickly (33 delta currently).

3. Short a little Couer Mining for fun at $15.75… it’s up 535% YTD.


Subscribe at https://bullseyebrief.com

Elephants, Donkeys & Dogs (Issue #10.2 – 8/5/16)

Elephants, Donkeys & Dogs

5 Reasons to Buy Puts Now

  • 19 mini sell-offs in 5 years have generated average declines of 7.45%
  • September is historically the weakest month for stocks since 1929
  • Highly defensive sectors are outperforming the broad market four to one
  • The Volatility Index (VIX) near historic lows means puts options are relatively cheap

Cable news networks have never had it so good. Viewership is through the roof as politics go 24/7 and AC provides refuge from the heat. America has become so enthralled with the election that nothing else seems to matter. Olympics in Rio? I’m still waiting for the buzz. What about Naval Action in the South China Sea, or a Breakthrough in Syria… Nope. Stocks at all-time highs? Hello? In these Dog Days of
Summer I hear nothing but crickets. Donkeys and elephants have stolen the show. I think we’d be wise to distance ourselves from this heard and recognize risk is seldom so singularly focused. Time to buy insurance and protect our capital.

I want to present several charts and graphs to illustrate why I am a buyer of S&P 500 puts. I think they help tell the story more poignantly than words alone. While I recognize the world’s central bankers effectively have our back and will immortally do “whatever it takes” per ECB President Mario Draghi, too many indicators are gnawing away at me, starting with this one:

1. Sell-offs Happen… Frequently

S&P 500 Index

FullSizeRender-31

The S&P 500 Index has experienced 19 sharp declines of 7.45% during the past 5 years, with half of them happening in the past 2 years and generating some particular nasty downdrafts. As you can see on the far right side of the chart, the index is now perched at all-time highs as if poised to produce another “golden arch” –fries not included. I fully recognize the market bounced back each of those 19 times, but I also recognize the index trades at an historically rich 18.4x earnings (assuming $118) and FactSet now forecasts a sixth consecutive quarterly earnings decline come 3Q reporting season. Ask yourself why you are buying all-time highs absent earnings growth. If it’s because the Fed has your back, and you have no place else to go, by definition this picture should make you uncomfortable. You need insurance in the form of puts.

2. Approaching Seasonal Weakness

Monthly Returns Since 1929

Jeff Hirsch and his team at the Stock Traders Almanac have done some excellent work on seasonal tendencies across markets over long periods of time. Among their best known and oft cited observations, the S&P 500 Index typically posts its worst month in September. It has declined an average of 1.1% during September since 1929 and it’s one of only three negative months of the year. This would not be reason enough to buy puts, but in light of valuation and the apparent stalling out at new highs from our previous chart, it’s another reason to play it safe. We are entering the seasonally weakest month of the year, meaning the odds are less in our favor. As we try to smooth out returns and differentiate ourselves from the indexers, we need to be aware of the potential for downdrafts and protect against them. Speaking of safety, look what’s leading performance this year…

3. Awkward Leadership (aka The Last Shall Be First)

Returns YTD

There is only one reason why slow-growing Telecom and Utilities are outperforming the broader index this year by 4 to 1: Dividend Income. They yield 4.4% and 3.1% respectively, which significantly exceeds the 1.9% average for the broader market. Income is a fine reason to own stocks in an anemic low growth environment where the 10yr Treasury yields about 1.5%. However, safety is not indicative of a bull market. Boring consumer staples are so over-owned right now they trade at 23x earnings and yield just 2.5%. In addition, only 60% of the 500 stocks in the index are above their 20-day moving averages, compared to 95% three weeks ago. This tells me fewer stocks are holding us up. When breadth declines and defensive groups are leading, I get uncomfortable about a downdraft.

4. No Trend Whatsoever

Real Clear Politics Polling Average

FullSizeRender-28

The inability of either candidate to breakout from a plus/minus 5% margin of over any period longer than several weeks is highly challenging for anyone trying to deploy longterm capital. There is simply no discernible trend. While we can argue Clinton is good for hospitals through increased government backed funding, Trump would presumably be the opposite. Similarly contrasting outcomes can be made for coal, drilling, multinational tax policy and even defense (On this last point, Trump’s America first orientation might make him LESS tolerant of overseas defense spending than Clinton… how’s that for a mind-bender). My point is markets ABHOR uncertainty and the dynamics of this election are more uncertain than any in recent memory. With still nearly 100 days to go, I suspect there will be enough nervous energy to create more than one unpleasant sell-off in coming weeks.

5. The Crocodile (see the teeth?)

S&P 500 Index vs the Volatility Index

FullSizeRender-27

My thanks to Minyanville Founder Todd Harrison for sharing with all of us his favorite chart depicting “animal spirits.” He calls it the Crocodile chart because of the ominous gaping jaws at the far right. The SPX at all-time highs and the VIX near all-time lows create the image of a croc with its mouth wide open and ready to pounce. Admittedly not very scientific but a great image nonetheless. It reminds us stocks are expensive the volatility is cheap, which brings us to my actionable point.

–> Time to Buy Puts

I like trading options on the SPY, which is simply the S&P 500 Index with the decimal moved over one place to make transactions more affordable. So SPX at 2180 equates to SPY at 218.00. Additionally, I generally buy puts 2 months into the future which are slightly out-of-the money and will accelerate quickly in the event of a decline.

As an example, the September 30th puts struck at 215 cost 2.90 per contract. This is a total dollar outlay of $290 per $21,500 of notional exposure, which equals about 1.3% for 55 days or about 8.5% on an annualized basis.

Think about it. You can carry exposure into a risky time of year with unknowable election volatility and high valuation, or you can spend a small amount of money for peace of mind. For me the choice is clear. Buy puts.

Now go enjoy your August vacation.

Subscribe at https://bullseyebrief.com

Less Is More (Issue #10.1 – 8/5/16)

Less Is More

Three ETFs to Own Forever

  • Three distinct ETFs provide exposure to long-term Innovation, Consumption & Income
  • Leading innovators reinvest 26% of sales in R&D and Capital Expenditures
  • Very few ETFs reinvest dividends automatically and pass along commission savings
  • Even indexed ETFs can produces significant variance in returns over time

Simplicity can be beautiful. Distilling an investment theme into one word often helps crystalize a thesis and focus the objective. This year for example it would be Oil… as in oil fell too far in Q1 and well-capitalized drillers got too cheap, creating deep value opportunities. Brexit and Income also come to mind. I mention the strategy because a seasoned and somewhat cynical investor recently asked me which stocks I’d want to own forever, if I could only buy three. Talk about sharpening your focus!

The more I wrestled with the question, the more I found it both plagued my intellect and tickled my imagination. What a challenge: Finding three companies which could somehow encapsulate everything exciting about investing. For me, growth would obviously have to figure prominently –we’re talking forever– but so would income and a sense of value. I ran screens of every combination imaginable, and even back-tested them over 25 year periods. Suffice to say what works in one decade doesn’t necessarily work in another.

My Ah-Ha Moment

I was beginning to think this was an exercise in absurdity, and then it dawned on me: What if I focused instead on ETFs? Specifically three which reflect three timeless themes of Innovation, Income and America’s insatiable appetite for more. Since the average stock spends only 9 years in the S&P 500 Index, choosing an ETF minimizes the risk of hitching the cart to an aging  horse. True, ETFs bend the original parameters slightly, but so be it. Here are my three to own:

1. Innovation

In this political season of promises to “Make America Great Again” I am reminded of Ronald Regan’s message of “Morning in America” and it’s a theme which replays generation after generation. Innovation and an ability to reinvent has propelled Corning Glass through countless economic cycles, from Edison’s first light bulb to the Gorilla Glass on an iPhone. Fracking has turned the U.S. into the world’s third largest oil producer behind Russia and Saudi Arabia. Likewise, targeted immuno-therapies pioneered in the labs of Boston promise to convert virus cells into cancer killers.

The common link is technological innovation. It’s one of the reasons Google (okay, Alphabet) has become a must-own name. Tesla too if you can stomach the valuation. I know I can never pick just one company or even one vertical to capture this powerful force, so I need a team which can effectively allocate on my behalf. For this task I select BlackRock’s iShares Technology fund IYW. As I survey the top four holdings which collectively account for 47% of allocation, they tick nearly all of my boxes which define must-own game changing companies.

What Defines a Game-Changer

only3b

Only3c
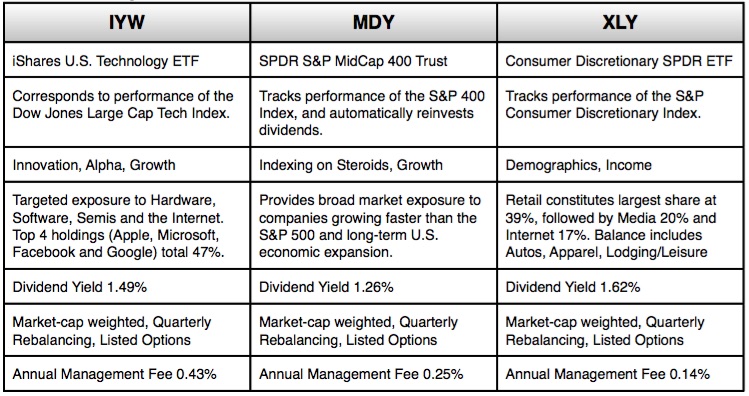
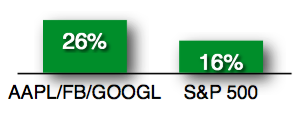
Bloomberg lists a total of 35 technology ETFs. I selected IYW because it offers the highest exposure to Apple/Facebook/Google (35% of assets). These three companies reinvest an average of 26% of sales back into R&D plus CapEx, compared to 16% for the S&P 500 Index. These companies are committing $84B annually in pursuit of new solutions. They clearly BELIEVE in their ability to innovate, which I find very attractive.

In addition, the IYW provides access to a total of 141 companies, compared to median of 69 holdings for all the tech ETFs. As a result, I think of IYW as a targeted bet with an embedded call option on a promising basket of up-and-comers. Buy it. Hold it. Watch it grow.

2. Turbo-Charged Indexing

The S&P 500 Index serves as the U.S. equity index of choice, but it’s hardly representative. It constitutes only the largest 500 publicly traded companies, meaning it excludes about another 3,500 trading on the NASDAQ and NYSE, or 6,000 if you include micro caps traded off-exchange.

While looking at big companies like GE (GE) and Exxon (XOM) might seem intuitively safer from a longterm point of view, these companies are generally not growing as quickly as their slightly smaller mid-cap brethren. What’s more, risk-adjusted returns measured by Sharpe Ratios are actually quite similar (0.49 for MID vs 0.52 for SPX currently), meaning you give up very little to capture additional potential upside. The switch can make a big difference over time. $100 deployed 25 years ago into The MidCap Total Return Index (dividends reinvested) is worth $1,139 today, compared to $896 for the S&P 500 Index.

FullSizeRender-33

There are several ETFs which provide exposure to the Mid-Cap Index but only the MDY reinvests dividends automatically. It’s able to do this because it’s structured as a unit trust, whereas the other funds simply credit your account with the dividend and you have to reinvest it yourself… incurring commission charges along the way that could potentially eat into returns. Given an annual cost of just 0.25%, the people at SPDR are giving the low-cost for at Vanguard a run for their money. If you are fundamentally supportive of long-term GDP growth, population growth, and inflation, the MidCap Index provides far greater upside with minimal incremental risk. I think of it as indexing on steroids.

3. More, More, More

Life, Liberty & the Pursuit of Happiness” constitutes a uniquely American perspective which has created a generational engine of growth unlike any other country in the world. By creating an inclusive environment which attracts talented and motivated only3e
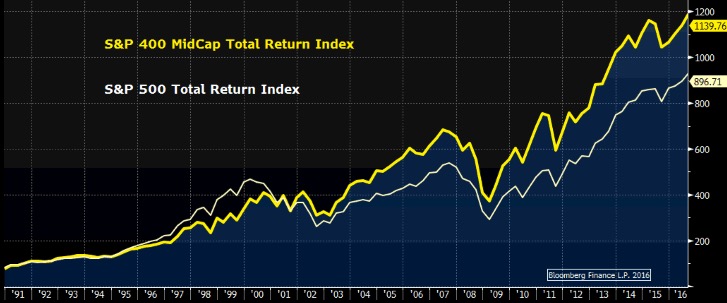
entrepreneurs (Mr. Trump, are you listening?) free of regulation and onerous taxes (ahem, Ms. Clinton?), the U.S. produces 24.4% of world GDP with just 4.5% of the world’s population. This is an incredible testament to U.S. productivity, which speaks loud and clear of the American Dream. While oil-rich countries with smaller populations like Kuwait and Norway can claim higher per capita figures, the average American household earns $53,657 per year. More importantly for our purpose as investors, Americans spend approximately two-thirds of this income consuming products and services (the balance goes to taxes and savings). –> There’s a reason why former Fed Chair Greenspan called Wal-Mart each month to track consumer expenditures…

So as I reflect on what I want to own forever, I want an index which allows me to participate both in aggregate growth and aggregate spending, since in the U.S. the are synonymous. You can see their relationship quite clearly when we chart population and GDP against the Dow Jones Industrial Average over the past 50 years. As demographics rise, so do stocks. Companies are feeding, clothing supplying and sustaining a rising and more productive population.

Hand in Hand

My ETF of choice in to reflect this intertwining of expansion and consumption is the Consumer Discretionary Select Sector SPDR Fund (XLY). It’s the undisputed leader among the 19 ETFs providing exposure to the consumer discretionary sector. XLY ranks number one in performance over both 5-yr and 10-year periods, generating annual returns of 17.25% and 11.36% respectively. It’s also the most liquid, with an average daily trading volume of 7.2M shares. Finally, it’s one of the most efficient, charging a fee of just 0.14% per annum.

As for allocations currently, XLY is 39% retail, 20% media and 18% Internet (which I suspect will grow over the next 5-10 years, most likely at the expense of retail as they merge ever closer). The balance of the fund is distributed across auto, apparel and entertainment. Amazon (AMZN) is the largest holding at 12.6%. The 88 components also include The Home Depot (HD), Comcast (CMCSA), The Walt Disney Company (DIS), McDonald’s Corp (MCD), Starbucks (SBUX) and Nike Inc (NKE).

Subscribe at https://bullseyebrief.com

Brex-ageddon Not (Issue #9.3 – 7/22/16)

Brex-ageddon Not

Four U.K. Property Plays

  • Retail withdrawals in the wake of Brexit have necessitated selected asset sales
  • Trophy London addresses still command trophy valuations despite uncertainty
  • Prime London office rents are at record highs and significant premiums to Manhattan
  • Discounted funds offer a rare entry point for value-minded investors


Analysts and policy makers are doing their best to convince us the end is nigh for London’s vaunted property market. So sorry to disappoint them. In spite of dire forecasts this week from both the IMF and ECB raising odds of U.K. recession to 40%, international capital looking for opportunity has already sailed up the Thames. Seasoned investors recognize London rarely goes on sale, and early indications suggest discounts on trophy properties are too attractive to pass up. Arguably, separating itself from the E.U. may have established the U.K. as Switzerland 2.0 and pros want in.

The seven publicly traded U.K. property funds controlling £18 billion in assets have had quite a month. Immediately after the Brexit vote, retail investors in the U.K. created a stampede of withdrawals that forced trading suspensions, BrexNot 2 The Gloom Crew
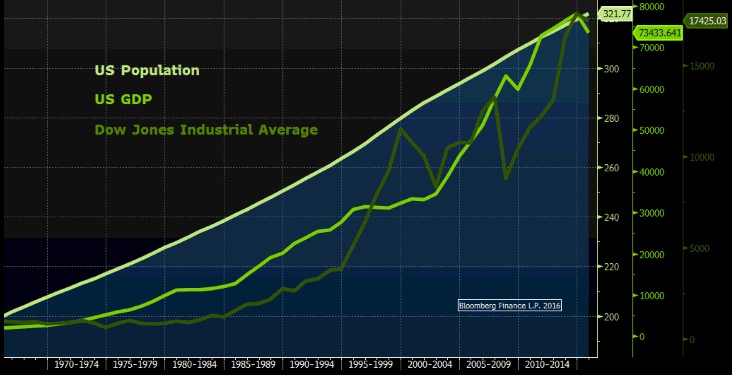
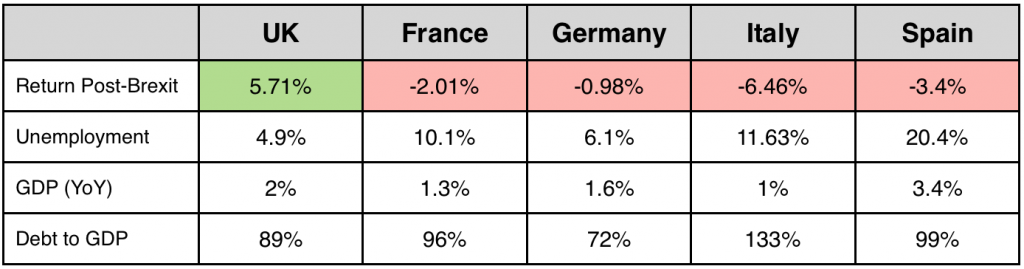
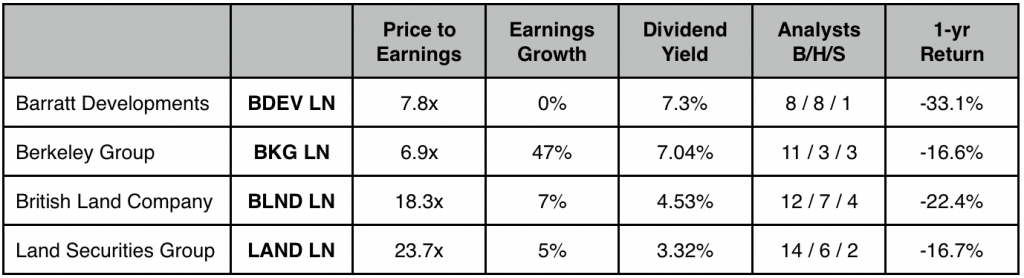
NAV write-downs of 20-25% and immediate negotiations to begin liquidating assets in order to satisfy redemptions. Analysts piled-on and share prices plunged. In less than a week, several stocks got cut in half. Then something funny happened: Institutional buyers showed up. As retail holders clamored for cash, pros opened their checkbooks.

The FT has reported on several transactions which have come together particularly quickly, and at particularly strong valuations. British Land Company PLC (BLND LN), the U.K.’s second largest REIT announced July 7 it sold the department store leased BrexNot 3 Keep Calm and Carry Onto Debenhams for £400M, which equates to a cap rate of just 2.75%. That’s more expensive than the record 3-5% cap rates being paid in Manhattan. It’s also a significant premium to the 7% rate paid for the same property in 2008.

Similarly, Aberdeen Asset Management PLC (ADN LN) is offering an office building at 10 Hammersmith Grove housing FOX International and initial bids are reportedly just 50 basis points off pre-Brexit indications. While Aberdeen did sell one property to Noway’s Norges Bank at a 15% discount for £124M, real estate executives quoted by the FT say this is the only fire sale thus far. Per Aberdeen U.K. Fund Head Gerry Furgeson, “A limited number of properties are being marketed, following a period of higher than normal redemptions after the EU referendum.

Why Insiders are Bullish

Demand for commercial property in London is extremely strong. The vacancy rate is just 2.6%, its lowest ever and well below the 4.3% long-term average. Tenants have rented a total of 14.7M sq. ft. in the 12 months ended March 31 according to Bloomberg, well above the 10-year average of 12.9M. As a result, rents for prime office space have risen 7.7% YoY. In dollar terms, the average rent is now $1,271 compared to $877 in Manhattan. Even adjusting for the Pound’s decline, a prime office in London costs 31% more than a comparable space in Manhattan. True, 51 projects under construction will add 14.2M sq ft of supply, but that will be absorbed in one year if demand continues at the same pace as the past 12 months –and as noted, London is virtually sold out.

Nice Work, Mate!

Pensioners and retail investors seem not to have noticed. They desperately want their money back. So Aberdeen has twice marked down the Net Asset Value (NAV) of its lead fund since Brexit, bringing the total discount to over 20%. Aberdeen is effectively telling investors they can get out, but it won’t be pretty. More importantly, the 20% discount offered to fund investors exceeds the 15% discount paid by property buyer on the “one” distressed sale noted in the FT. In other words, Aberdeen is still making a 5% spread even on its worst transaction. That’s what we call arbitrage. Fear on one side, knowledge on the other.

The tension between nervous retail holders and value-minded investors is evident in the way the seven parent companies of halted property funds have traded since the Brexit vote June 23. Initial plunges of 20-30% have given given way to a steady rebound. At this point, they are down about 15% on average. In the case of Aberdeen, whose asset management business is diversified well beyond real estate, shares are actually 6% higher. #WhatDistress?

7 U.K. Property Related Equities

Returns Since Brexit
BrexNot 4 Returns Since Brexit

There are some clear messages here. The obvious one is Don’t Panic. Another is Follow the Pros Not the Herd. The most important is Consider the Data. In addition to the specifics on the London property market, thoughtful investors recognize the U.K. economy is significantly stronger than continental neighbors. The U.K. has stronger growth, more people working, and less debt. As politicians like Boris Johnson made clear for months ahead of the vote, there may well be a legitimate argument in favor of the U.K. as a safe haven play from Pan-European malaise.

The Big Picture
BrexNot 5 The Big Picture

What to Buy

There are four liquid, commercial real estate equities on the London Stock Exchange. This is the best way for Americans to gain exposure to the thesis that public CRE vehicles in the U.K. are oversold and should be purchased.

Note: I called the U.S. office of Aberdeen to inquire about purchasing its lead U.K. Property Fund. It’s not that easy for Americans. Only off-shore entities can acquire shares, which means the average U.S. investor cannot participate. Keep it simple and consider only the four equities below.

U.K. Property Plays for Americans
BrexNot 6 UK Property Plays for Americans


Subscribe at https://bullseyebrief.com

Robo-Trader (Issue #9.2 – 7/22/16)

Robo-Trader

The Geek Beating Wall Street

  • Dodd-Frank has curtailed broker-dealer positioning by two-thirds in two years
  • Trading revenue at the largest U.S. banks has fallen 18% since since 2011
  • GOP and Democratic platforms alike target further restrictions on bank capital commitment
  • Automated trade matching through FinTech innovation provides roadmap for future


Tough time to be a trader, unless you’re part machine. Dodd-Frank legislation introduced in 2010 has gutted Wall Street of it famous chest pounding market makers. Forced to carry less risk under the watchful eye of SEC observers, big banks have cut way back on committing capital and making markets, even when they’re supposedly facilitating customer business. Where silver-backed gorillas once shouted orders, soft-spoken engineers now write code to match buyers and sellers. Call it Geek Chic, and one company is minting millions. But we’ll get to that in a moment.

Fin-Tech has become the new buzzword among bi-coastal digerati. In the first quarter alone, global
FinTech investment totaled $5.3B, a 67% increase over last year. From Citadel Securities hiring Microsoft executive Kevin Turner, to the rise of automated online advisors like Betterment and Robin Hood, the implicit merger of Silicon Valley and Wall Street provides a front row seat to Darwinian survival. Wall Street is under fire and it needs help. Silicon Valley has money and it wants returns. Anyone who can make a finance company look more like a tech company stands to make significant amounts of money.

No Trading Allowed

Primary Dealer Holdings ($MM)
RoboTrader 2 Primary Dealer Holdings ($MM)

Consider what has happened to position taking by U.S. financial institutions during the past several years. Data compiled by the Federal Reserve Bank of New York reveals average weekly holdings by primary dealers in agency, corporate, government, municipal and asset-backed bonds has fallen from $45B to $15B. This represents a decline of 67% in just two years. No wonder Goldman Sachs reported net revenue declines of 13% in the second quarter and has laid-off 400 sales/trading employees so far this year.

Credit declines to The Volcker Rule, which limits capital commitment by broker-dealers to just 4% of assets. It took effect April 2014 and as you can see the impact was immediate. More recently, with the inclusion of Glass-Steagall language into the GOP platform calling for the separation of commercial and investment banking, traditional party lines blur yet again. Donald Trump’s Republicans appear to have borrowed a page from Senator Warren’s Democrats. To quote James Bullard, President of the Federal Reserve Bank of St. Louis:

“There is a tendency to view large financial firms as national champions, deserving of protection. Because of this, we are evolving globally toward a regulated utility model—whereby very large financial institutions are under heavy regulation, which in my view makes them unlikely to innovate effectively in the future. This may leave them vulnerable to coming waves of financial innovation.”

Enter a company called MarketAxess Holdings Inc. (MKTX) founded “way back” in 2000 by J.P. Morgan alumnus Richard McVey. MKTX operates an electronic platform between dealers who act on behalf of institutional clients to transact in four primary fixed income markets: U.S. High-Grade, U.S. High Yield, Emerging Markets and Eurobonds. For years it sat quietly behind the scenes, and then Dodd-Frank opened the floodgates. Volumes tell the story.

FICC Trading Revenues

Percentage Change 2011-2015

Whereas the large U.S. banks have seen significant declines, trading volume at MarketAxess has seen significant growth. During the first quarter alone, volumes rose 27% to $310B. The company estimates it now commands 15% market share in three of its segments, while high-yield is about 6.5%. Given the breadth of global fixed income markets, MKTX has considerable opportunity to expand:

1. MKTX operates as a broker’s broker, meaning competitors like Goldman Sachs actually choose to post bids/offers on its site to a.) generate additional liquidity b.) protect the identity of its customers. Ability to execute and confidentiality are paramount on Wall Street. Here MarketAxess is positioning itself as unrivaled.

2. MKTX still captures only a fraction of the total global fixed income, meaning there is ample opportunity to expand. Using SIFMA’s estimate of average daily fixed income volume of $700B, MKTX has a global market share of less than 1%. The company added 54 hires in Q1, bringing total headcount to just under 400. The majority of hires are either in programming or sales.

3. Its average commission of $204 per million dollars of bonds traded undercuts dealers by significant multiples, as dealers charge commissions/market-ups whereas MKTX operates more like a toll operator. Large banks with higher cost structure simply cannot compete. In spite of razor slim commissions, MKTX ability to scale produces head-turning profit margins of 33% and ROE of 28%.

Buy the Dips

Q&A

How do you interpret this chart?
The stock has risen steadily for two years, most recently to an all-time high above $150 from $135 in June. A total of 14 transitory declines averaging 10.8% have proven excellent entry points. It’s in an uptrend, just pick your spots strategically.

What’s the valuation?
It’s expensive. MKTX trades at 49x this year’s earnings, 16x sales and 13x current book value.

Are you insane?
No. MarketAxess is transforming the largest securities market in the world, and the biggest players are its customers. This is a premier FinTech story for the next several years. It’s about growth, not value.

When does the company report earnings?
The morning of July 28th, before the open. Seven analysts cover the stock, and on average they forecast 24% sales growth to $93.6M and 32% earnings growth to $0.85.

What’s your plan?
Buy the stock after the report. MKTX has sold off an average of 3.9% the day following earnings for 8 of the past 10 quarters. Like the 14 dips in the past 2 years, all have proven excellent entry points.

Subscribe at https://bullseyebrief.com

Prescription for Profits (Issue #9.1 – 7/22/16)

Prescription for Profits

Three Ways to Scoop Health Care Now

  • Health Care’s 17.8% share of GDP has made it a political punching bag for candidates
  • Majority of stocks in the group have fallen 30-40% during the past 12 months
  • Credit Suisse analysis of historical patterns pre/post election argues for buying now
  • Seven highly rated healthcare companies offer potential 31% upside at current prices

Call a doctor, if you can find one. They’ve become Washington’s latest scapegoat, as vote-seeking politicians on the campaign trail fume over rising healthcare costs. Competition for votes has reached such a fevered pitch that Ms. Clinton now favors a government option to compete with HMOs, while The Donald promises to cut Americans’ prescription costs by $300 billion (which is more than the entire country actually spends). We can chuckle about how politicians never let the facts get in the way of a good story, but their impact on health care is no laughing matter. Over the past year, large cap pharmaceuticals have fallen 35%, compared to a gain of about 2% for the S&P 500. Biotech and Hospitals have fared even worse.

Call the Doctor

No Health in Healthcare

Loses of this magnitude turn even sanguine investors into high risk patients. Nearly every group within the health care sector has suffered –the one exception being medical devices, where the tax increase meant to fund the Affordable Care Act has been postponed for 2 years. The question for investors is whether the group offers value, either because we can quantify the potential policy risks to operating margins or because we can identify catalysts to future growth.

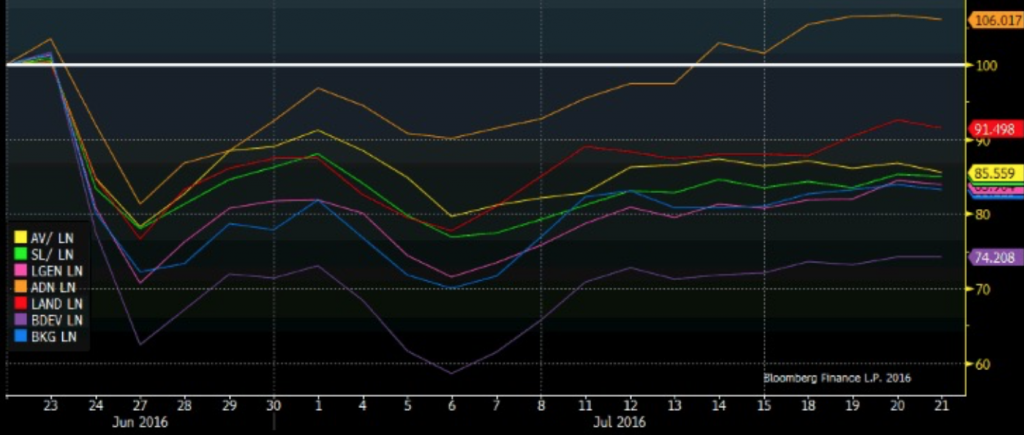
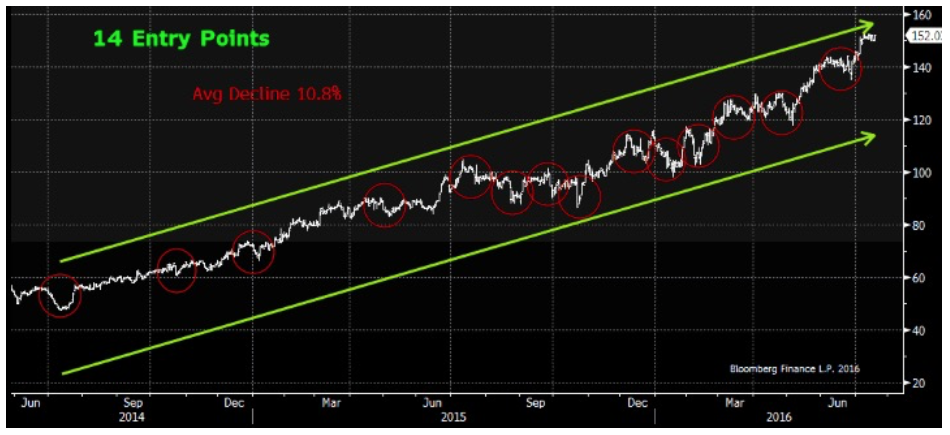
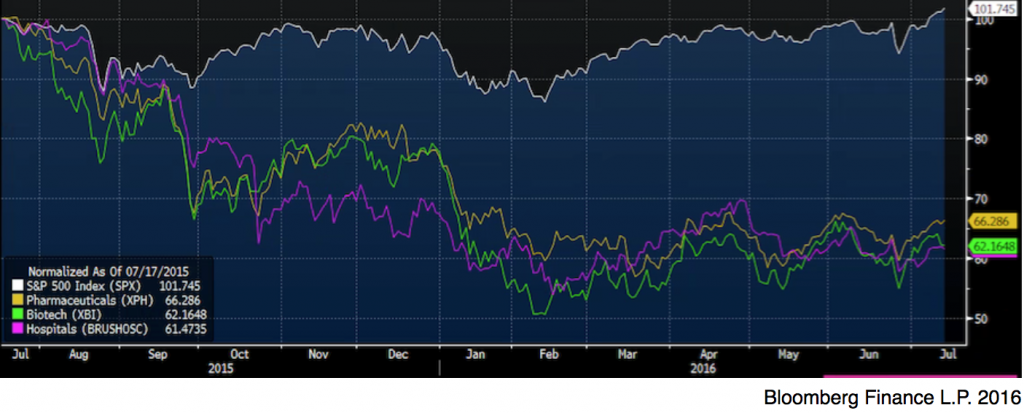
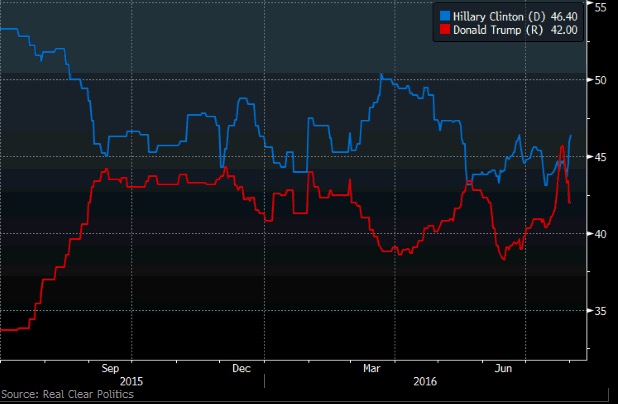
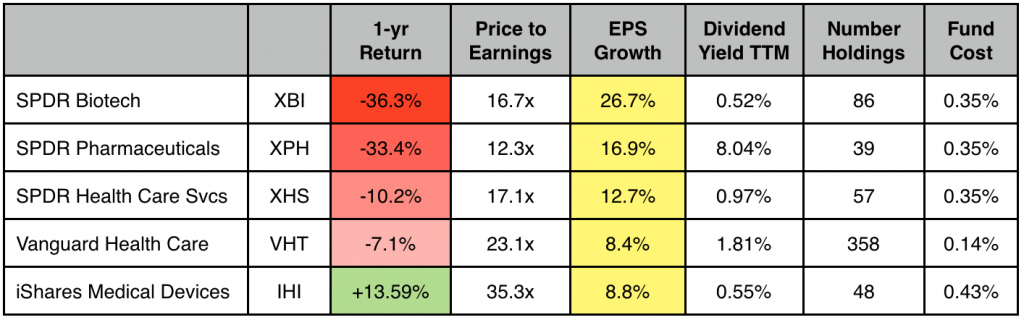
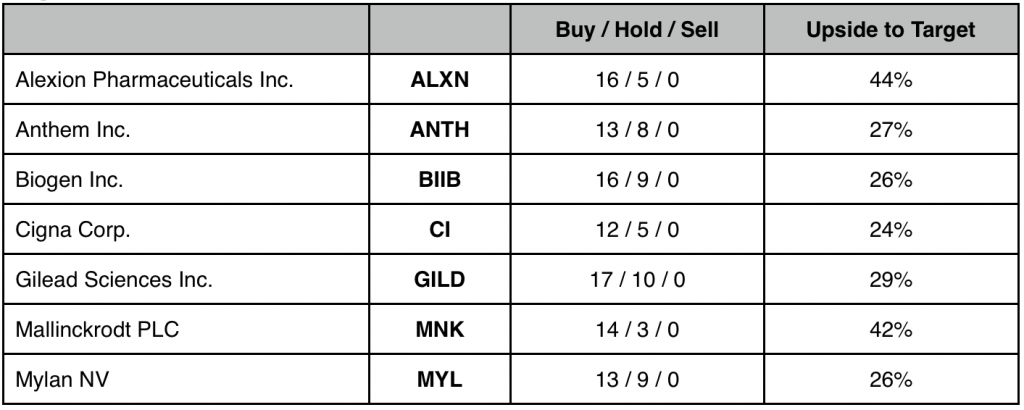
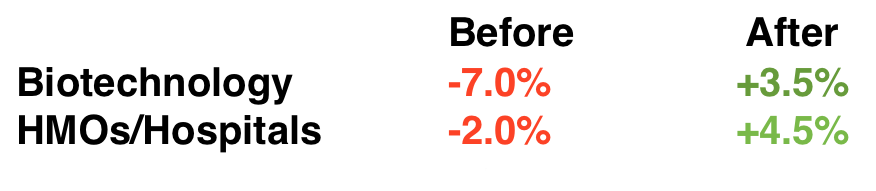
For starters, history implies a far more positive prognosis for health care investors post election. Credit Suisse analyzed stock performance of health care companies during election years since 1984 and found they tend to languish ahead of elections, then rebound once the veil of uncertainty is lifted. Writes analyst Scott Fidel, “P/E multiples for MCOs and EV/EBITDA multiples for hospitals tend to trade at discounts to 5-year averages leading into election day… and political uncertainty is intensified this year.” This intensity is due both to the closeness of the race and healthcare’s 17.8% share of U.S. GDP. It has become the ultimate political lightning rod.

Looking at what they candidates are saying (which may bear little if any resemblance to what they will ultimately be able to accomplish if elected), you can understand why health care has underperformed by so much more than the historical perspective offered by Credit Suisse. Candidates on both sides are saying whatever they need to say to attract the highest number of potential voters. Recent polls suggest dead heats in Florida, Iowa, Ohio and Pennsylvania. In addition, 34 senate seats and all 435 house seats are in contention, with no clear patterns yet emerging. You’d better believe they’re going after health care.

Tough Talk

Healthcare 4 Tough Talk Hillary“The present system is unsustainable. The only question is whether we will master the change or it will master us. I am offering a specificic agenda which will get us to universal health care coverage. That’s what I will do as President.”

Healthcare 5 Tough Talk Hillary table

Healthcare 6 Tough Talk Donald“Since March of 2010, the American people have had to suffer under the incredible economic burden of the Affordable Care Act–Obamacare. We’re going to repeal and replace this horror, and it is a horror.”

Healthcare 7 Tough Talk Donald table

This Sounds Bad… Why Invest in Health Care Now?

1. Because it’s cheap and oversold.
2. Because sentiment is at multi-year lows.
3. Because underlying growth is strong.
4. Because dividend income is attractive.
5. Because the bark is louder than the bite.

In spite of the rhetoric, the demand side of the health care equation looks quite robust. The Obama Administration last week week released a study published in the Journal of Health Affairs http://healthaffairs.org/blog/2016/07/13/health-expenditure-projections-when-does-new-become-normal/ The authors make clear total dollar volume flowing into health care already dwarfs flows into every other sector and gross expenditures are increasing. Health care is a monetary tidal wave. Away from the noise, I favor focusing on the facts:

• U.S. health spending in 2016 will exceed $10k per person for the first time
• Total health care expenditures equate to 17.8% of GDP, and will rise to 20% for 2025
• Health care spending will outpace GDP over the next decade by 1.3%
• 3 million baby boomers will reach retirement every year for the next 25 years
• Life expectancy has risen to a record 78.8 years per the Center for Disease Control (CDC)
• Boomers will require 1.6M new care providers by 2020 per the National Council on Aging (NCOA)

So What do We Buy?

Investors have three choices: Broad-based exchange traded funds (ETFs) which provide overall exposure like Vanguard Health Care fund (VHT); sub-sector ETFs which focus on specific verticals within health care; individual Best-in-Breed stocks. As we can see from the data, some groups like Medical Devices and Services have fared better over the past year than others, namely Pharma and Biotech. Note, hospitals do not have their own ETF. They are included within Services.

Heath Care ETFs

Healthcare 8 Healthcare ETFs

The call here is macro: Political rancor ahead of elections has cast a pall on the group. Once elections end, campaign promises will recede and the slow-moving process of governing will recommence. This shift will provide cover for the group, and presumably lay the groundwork for a broad-based relief rally. As a result, I would opt for ETFs, most notably a combination of biotech (XBI) and pharma (XPH) since they are down the most.

I also recognize some of you prefer single stocks. So I am including a short list of highest-rated health care stocks chosen from among biotech, HMOs/MCOs, hospitals, pharma, life sciences, medical devices, and services. All are members of either the S&P 500 or 400 Indicies. Small caps were excluded. Criteria is straightforward:

• Potential 12-month upside of at least 25% to consensus target
• Mean analyst rating of at least 4.5 on a 5.0 scale
• No sell recommendations

Top Rated Health Care Picks

Healthcare 9 Top-Rated Heath Care Picks

Option investors may also want to consider selling premium as another means of effectively building a long position in depressed underlying securities, especially where implied volatility is above normal.

In the case of Mylan for example, the August 43.50 put trades at $1.10 with the stock at $45.50. Writing this put generates 2.42% over 30 days (29% annualized) and creates an entry point at $42.40. Since the stock already down 16% this year, that would imply owning MYL down nearly 23%. Not bad for a company currently trading at 9.2x earnings and growing 15%.

Subscribe at https://bullseyebrief.com

Report Card (Issue #8.3 – 7/8/16)

Report Card

Winners, Losers & Lessons at Mid-Year

  • THANK YOU for joining me as subscribers in my first quarter of business
  • 15 of 21 recommendations (71%) have generated positive returns since inception
  • Lower correlation within the S&P 500 Index creating opportunity to generate alpha
  • Renewed coordination by central banks to reflate assets still the key obstacle for shorts


Bullseye Brief has successfully completed its first quarter in business. I am profoundly grateful for your encouragement, patronage and frequent attaboy messages of support. 15 of 21 ideas presented in these first months have produced positive results, meaning I have effectively “hit the target” 71% of the time. I’ve scored one Bullseye with the data mining companies profiled in my first issue, they are up 29%. I have also missed a couple of marks, notably the gravity-defying staples I am short. Overall, I’m learning there’s a rhythm to balancing research, writing and marketing. As one of our fellow Bullseye subscribers shared with me recently, the key to success is “patience and perseverance.” Great advice, and I thank each of you for your trust. -AJ

Bullseye Performance Attribution

Returns as of June 30, 2016

ReportCard 2 Returns as of June 30, 2016

ReportCard 3 The so-called Matrix stocks
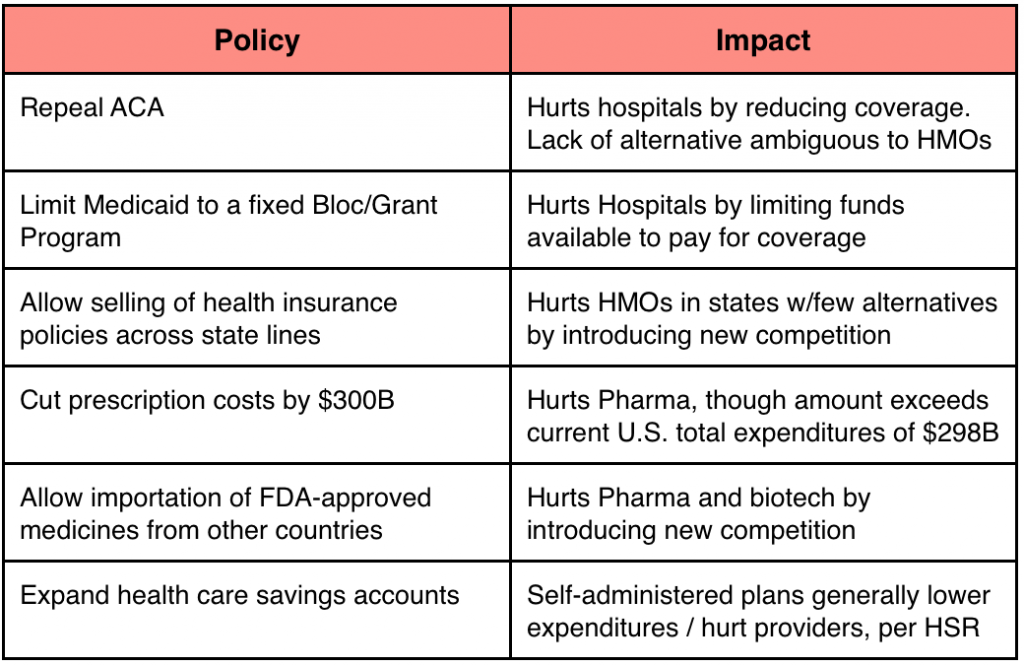
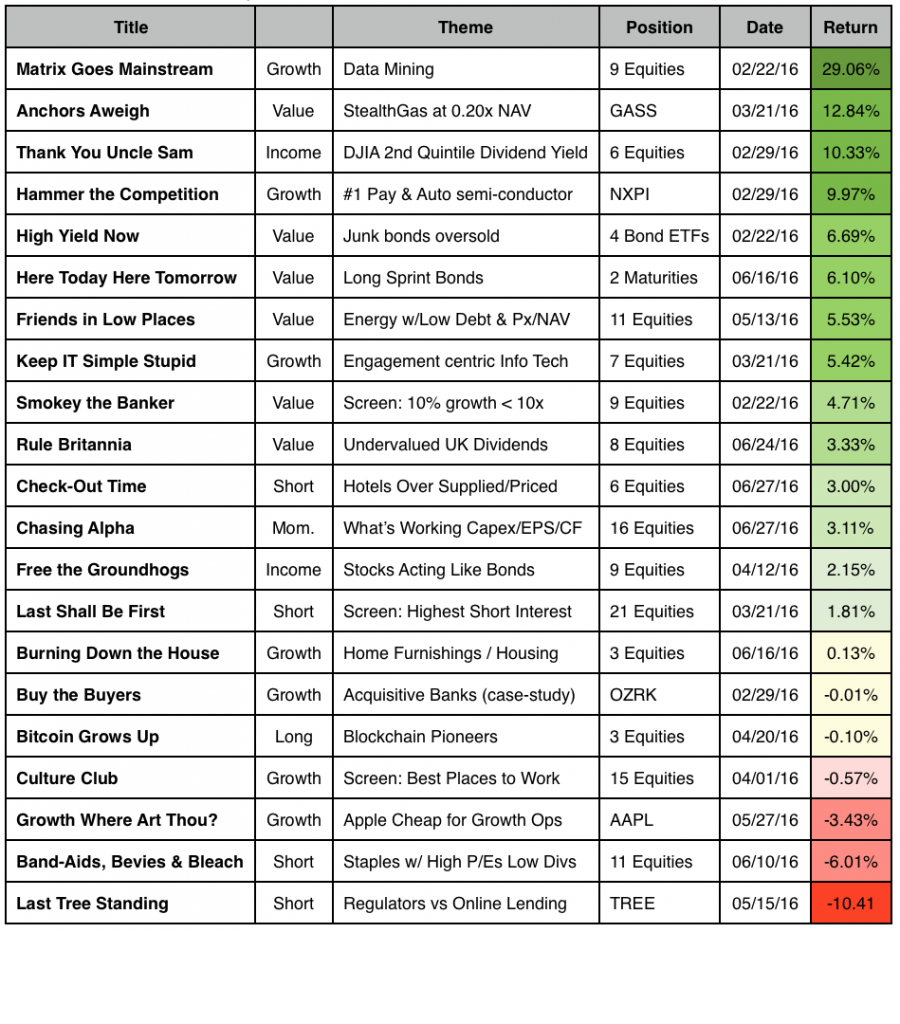
The so-called “Matrix stocks” have been on fire since my late February write-up, rising 29% or about three and a half times more the S&P 500 Index. These are the companies focused on helping businesses process and interpret reams of data generated by e-commerce, social media and the Internet of Things (IoT). Apigee (APIC) is a particular standout, having doubled from $6 to $12. The company derives its name from Application Programming Interfaces or API, hence Apigee. CEO Chet Kapoor explained to me in surprisingly plain English how APIs funnel facts/figures from company databases into simple spreadsheets so developers can create new apps. Data mining is evolving rapidly, moving quickly from Business Intelligence to Artificial Intelligence… i.e. from data interpretation to data prediction. This key theme will spawn more ideas in upcoming issues of Bullseye.


ReportCard 4 StealthGasStealthGas (GASS) is my second best performer to date up 12.84% since late March. It is also MY SINGLE WORST MANAGED POSITION. The stock rallied from $3.35 to over $5 in two months and I did nothing to protect the gains. I could have written all of you to say “put a little something in your pocket here” or at least put a floating stop on the position. Instead I have watched if slip back into the 3s. Admittedly, the fundamental story is still intact: StealthGas trades at a fraction of Net Asset Value (NAV), controls 20% of the global market for smaller Liquified Petroleum Gas tankers (LPGs), and is making money even at historic low day rates. As a result, it is still a buy. But instead of having fresh capital from $5 sales to redeploy into $3 purchases, I’m already committed. Bottom line: I grade the thesis A-plus, my risk management C-minus.


ReportCard 5 Consumer Staples
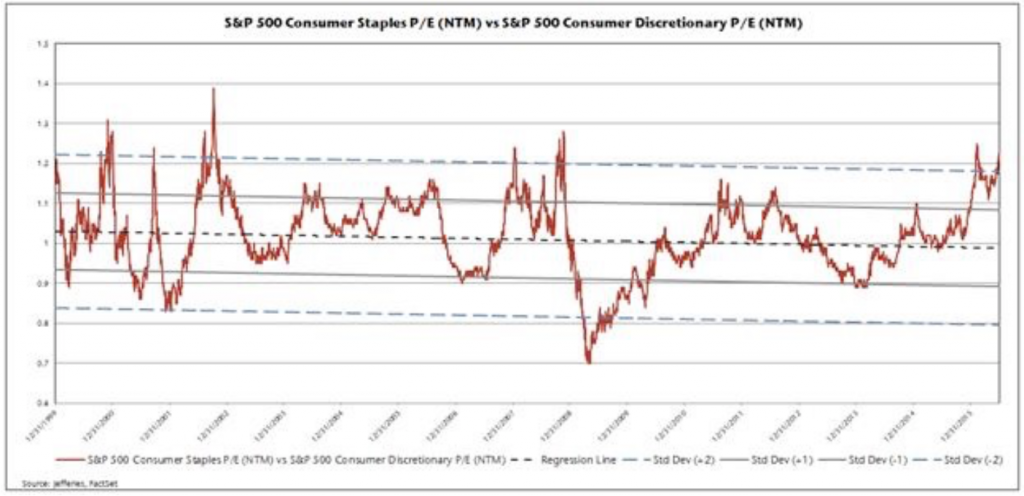
Consumer Staples continue to defy gravity. Many trade at earnings multiples of 30 times (nearly double the S&P 500 Index), in spite of low single digit earnings growth and dividend yields well under 2%. Predictability and yield were the entire thesis for long investors seeking safety and income. Now valuation has effectively rendered their appeal null and void… just don’t tell Mondelez. On June 30 it launched a bid for Hersey (HSY), which is one of the shorts on my list. Several have since popped 5-6%. Hershey has said, no thanks, as it did to both Nestle and Wm. Wrigley Jr. Co. back in 2002. Takeover bids aside, staples are relatively low volatility stocks historically, which partly explains why they’ve attracted safe haven investors since 2008.I would add to short positions, or at least by long-dated puts which represent a low cost way to position for an eventual return to earth.


Good News

My recent piece “Chasing Alpha” identifies several metrics like Capex and Earnings Momentum as key drivers for second half returns. Specific themes and individual stocks matter more now as correlation within the S&P 500 Index has dropped to 0.45 (meaning the 500 components move the same general direction less than half the time.) This bodes well for active managers, and raises the stakes for all of us to “get it right.” It also bodes well for long-weighted portfolios. After spikes in correlation, as we experienced first hand during the Brexit scare when global assets sold-off in unison, markets tend to rally.

Correlation Spikes –> Buying Opportunities

I conclude my self-evaluation with an excerpt from a piece I originally wrote for the J.P. Morgan Chase website entitled, “Six Months an Entrepreneur, Six Lessons Learned.” Please email me if you’d like the complete article.

Happy summer, and again I say thank you.

* * *

I have been blessed in my first six months as a small business owner. Family has offered support, friends have opened doors, and clients have paid on time! In fact, it’s going much better than I could have expected, with one critical exception. Managing myself is the hardest thing I’ve ever done. EVER.

I’m not talking about work ethic. Long hours come naturally to me, as do enthusiasm, creativity and pitching new business. I’m talking about the soft stuff they fail to teach at B-school: Emotion. Dealing with my own mood swings has proven far more challenging than anything else on my to-do list. One week I find several new leads, even land a client. The next week, zilch. This must be how actors feel!

The fact is, life is about ups and downs. Whether we’re starting a business, auditioning for a role or raising a family, progress rarely follows a straight line. I have found in these first months the less I self-evaluate, the better. Like an investor who spends the day staring at flashing prices on a screen, one minute I’m a hero and the next I’m confused. So for everyone who thinks you’re only as good as your latest achievement, I say “No way.” Consider instead going for a run, spending time with friends or family and taking a break. Lesson #1: Soften Your Grip.

Summer Fever (Issue #8.2 – 7/8/16)

Summer Fever

Five Cowbells of Caution

  • Equity strategists struggle to stay bullish as mid-year forecasts reveal 2.5% upside
  • Defensive strategies producing superior returns across multiple asset classes
  • Shareholder payouts exceed corporate profits ahead of fifth likely quarterly earnings decline
  • Bond markets telegraph low rates for longer


“I got a fever, and the only prescription is more cowbell.” Will Ferrell is hands down my favorite SNL star of all-time. Ron Burgundy, Ricky Bobby, Buddy the Elf… on and on. But Cowbell guy still gets my vote as the best Will Farrell character ever. Sorry Alex Trebek. Yes it was completely stupid, it was also totally brilliant. http://www.nbc.com/node/209806/video/1119596?auto=true#vc214886=1 Turns out, the bell-ringing metaphor was also strangely apropos. “Cowbell” aired on April 8 of 2000, just days after the NASDAQ logged its infamous tech top. I’m not saying SNL is really that good, but I am saying this market’s got a little fever, and I’m hearing pros ring cowbell.

I spent part of my July 4th weekend catching up on a few dozen research reports from some of the top strategists on Wall Street. This is an essential component of my due diligence, and since markets were closed I was able to concentrate without the usual interruptions. Things were going great, but after a couple hours I started getting antsy. So many smart people were expressing unease about markets and money flow, plus they were backing it up with data.

This is exactly how I myself have been feeling lately. Call it aches and pains, and while a fever may not put us in the hospital, but it can still make for some severe unpleasantries… just look at the 15% declines for Italy and Spain after Brexit. Cough Cough. So what’s the remedy?

Acknowledge that scratch in the throat and take some precautions.

• Give yourself some R&R by lightening exposure
• Flush the system of laggards
• Wrap yourself in a blanket of puts, or cash

I’ll get to portfolio specifics in a moment. First, five notable hits from the Cowbell Chorus:

1. Defense Goes Offense

S&P 500 Index Sector Returns (6/30)

There are only two reasons to buy telecom and Utilities: Dividends and Safety. For these two groups to have appreciated over 20% in just six months tells me there is an incredible concern about the health of the broader market –understandably so. U.S. corporations will likely enter a fifth consecutive quarter of falling earnings when they begin reporting 2Q results next week. In addition, the S&P trades at 17.5x an estimated $120 eps for 2016, which assumes second half earnings do an abrupt about-face and rise 8-10%. I recognize #hopespringseternal but I have a hard time figuring out where the growth will come from, especially since the largest U.S. companies derive about two-thirds of revenue overseas. Let me share two further observations. First, the S&P Telecom Index may be up this year, but the long-term story is so uninspired it’s still 43% below the 2000 peak. Second, Utilities now trade at a higher multiple than Technology. Quite literally, this market is upside down.

2. Turtle Beats the Hare

Staples vs Discretionary

SummerFever 3 Staples vs Discretionary

I know this chart is hard to read, but I’m thankful to Jefferies for the perspective it provides and I urge you to take note. It compares defensive consumer staples to expansionary consumer discretionary stocks, specifically as a ratio of their forward Price to Earnings multiples (P/E NTM). When the ratio rises, staples are our performing. Currently, the ratio has risen about 2 standard deviations, which has happened less than 5% of the time since 1990. Here’s what Jefferies quantitative team wrote to clients:

Typically, six months after the spread widens to 1 standard deviation in favor of staples, staples have underperformed discretionary by 6% but in the six months since crossing 1 standard deviation, staples have actually outperformed by 6%, which is unprecedented and suggests to us some convergence in the multiples.

Their data indicates staples typically contract by 500 basis points relative to discretionary three months after one standard deviation moves… currently we’re above 2 standard deviations. In plain English, this means SELL. I provided a list of stapes to SHORT in the Bullseye report dated June 10, so I am definitely on board with this one. https://bullseyebrief.com/band-aids-beverages-bleach-issue-6-1/

3. Spare a Dime?

U.S. Corporations Borrowing to Pay Shareholders

SummerFever 4 U.S. Corporations Borrowing to Pay Shareholders
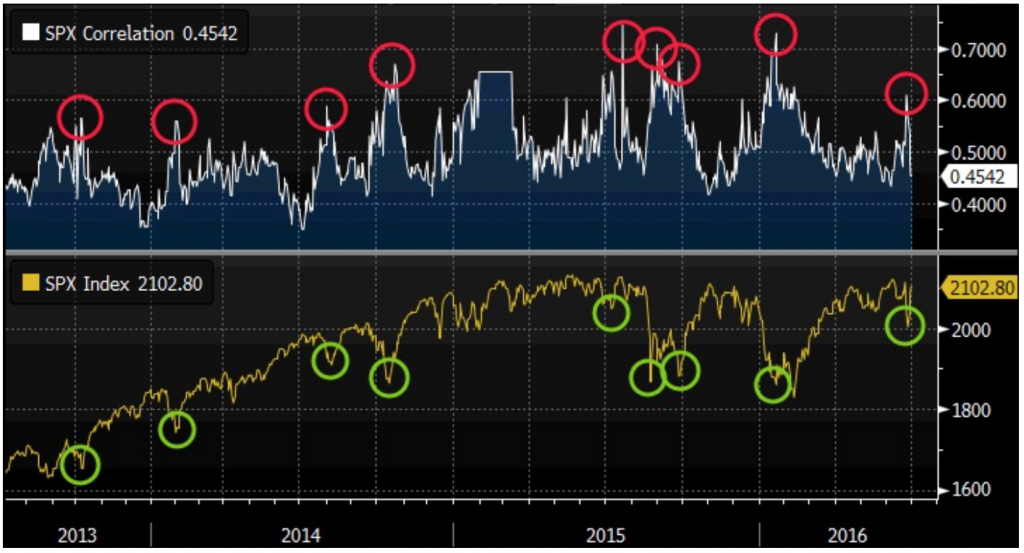
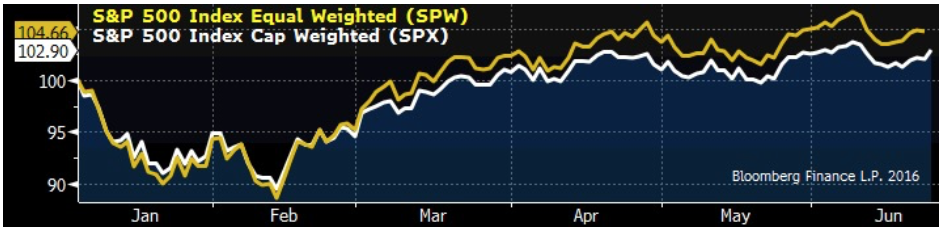
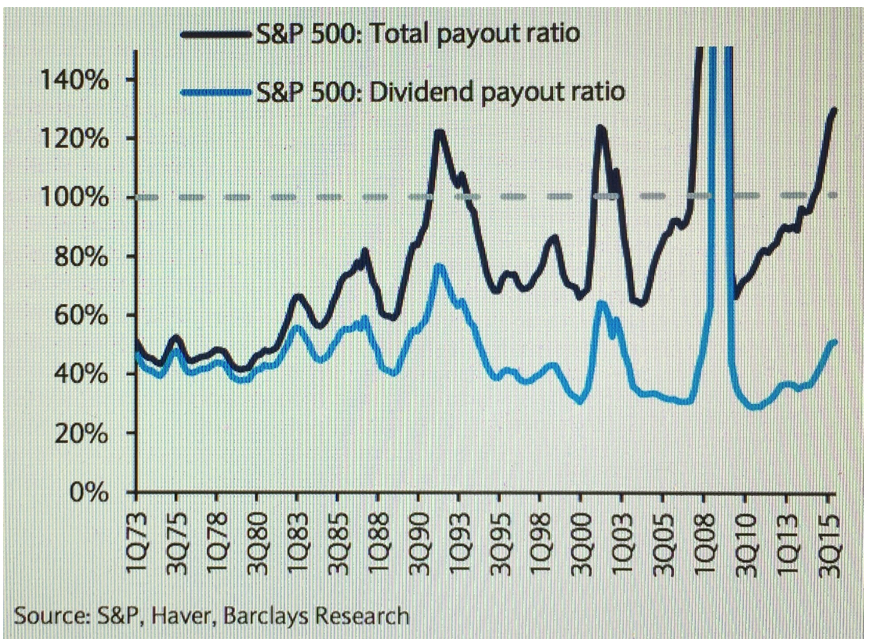
Barclays Head of U.S. Equity Strategy Jonathan Glionna offers some particularly sobering data for the fiscally minded among us. In his mid-year note to clients, he concludes U.S. corporations are paying money to shareholders which they simply do not have. Specifically, he examined payout rations by sector, defined as the total amount companies pay in dividends and spend on buybacks expressed as a percentage of net income. Think of it as the amount a corporation effectively gives back to share holders. One is a cash payment, the other raises earnings per share by lowering share count. Both are generally deemed rewarding…generally. The problem in this case is a combined (total) payout ratio of 128%, meaning corporations are paying out more than they earn.

Sometimes there’s a legitimate time lag, in that payouts during one period are funded by higher profits which accrue later due to accounts receivable balances or earnings offsets. For the most part however, payout ratios above 100% imply a drawdown of cash and/or funding through debt. What’s also troubling here, total payouts exceed 100% for all but three S&P 500 sectors (Technology, Financials and Energy). So the other seven groups are spending serious coin, coin they don’t have! As Mr. Glionna so keenly observes, buybacks reached an alltime high of $161B in the first quarter. In addition, companies with high total payouts historically have not appreciably outperformed the broader market, but merely kept pace. Borrowed money, borrowed time?

4. Heavy Metal

Ratio of Gold to Copper

SummerFever 5 Ratio of Gold to Copper
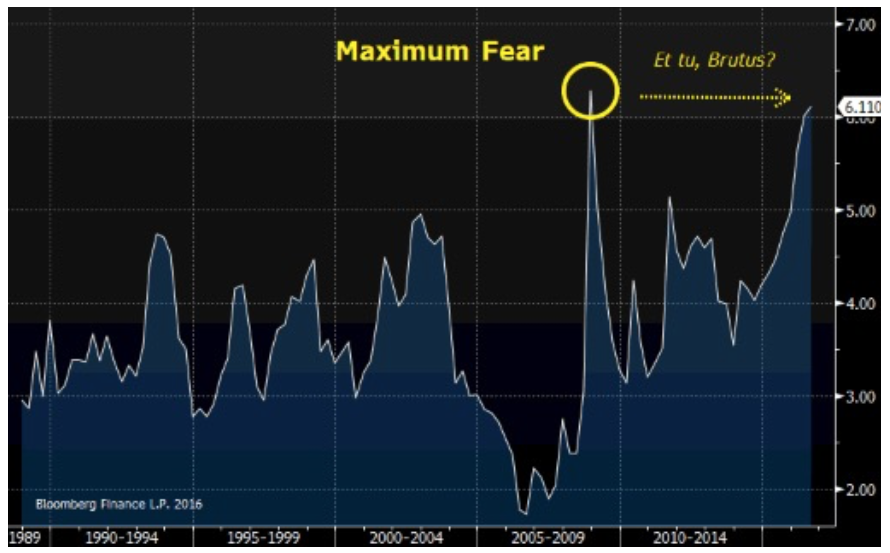
Gold has been on a tear this year, and it’s not due to industrial demand or the fabled Indian Wedding season, which can create short-term seasonal spikes of 15%. Futures have risen from under $1,100/oz last December to $1,350 recently. I admit I have missed this move completely, but I have certainly not missed the staggering outperformance of gold relative to copper. Whereas demand for gold as a store of value has soared, its industrial cousin copper has languished, and the ratio between the two now stands at 6.11 (meaning one ounce of gold costs 6.11 times more than 100 pounds of copper). This nearly equates to the peak during 2009. The disparity within metals reveals a larger disparity within markets: Can the Dow Industrials maintain a near record high with industrial metal demand at a near record low? One position implies hope, the other implies fear and I do not believe two such critical assets classes can sustain polar opposite viewpoints indefinitely. The rubber bands are getting stretched, farther and farther.

5. Compression Depression

Bond Market Going Comatose

SummerFever 6 Bond Market Going Comatose

My final chart says it all: Bond traders have compressed yields so much they think Chair Yellen will raise rates only 2-3 times in the next five years. That is NOT indicative of a growing economy. Here’s the math: the Fed Funds rate is currently 30 basis points and 2-year yields are 0.41%, meaning there’s only about a 44% probability of a 25 basis point hike in the next two years ((41-30)/25). Yes, you read that correctly…the next two years.

Looking further out, traders have compressed the spread between 5yr notes and 2yr treasuries from 140 basis points two years ago to 59 basis points today, which implies they see just 2.4 rate increases of 25 basis points through 2021 (59/25). On the assumption the Fed would be forced to raise rates if inflation accelerated –even if it really, really wanted to stand by Europe– such a glum outlook suggest little growth in the offing.

Now I’m Depressed. Thanks Adam

It’s not that bad. We can still make money on the long side, we just have to be HIGHLY selective in what we buy. Recognize the markets are sending some very uncomfortable signals. By the same token, global central banks continue to work in unison back-stopping disaster (#Brexit, Italian bank capital infusions, Puerto Rican debt, Japanification, etc).

Here’s the game plan:

• Clearly identify the theme and catalyst behind every long (Growth, Value, Income)
• Avoid “indexed positions” like SPYs and QQQs
• Write call premium against long positions when implied volatility expands (generally 30 days or less)
• Buy puts on broader indices on big up days (60 days out with strikes down 2-3%)
• Increase exposure to shorts incrementally
• Pare exposure generally

Current longs include themes like Data Mining, Dividends and One-off Value Ideas.
Current shorts include Staples, and Hotels opportunistically.

Inferno Italiano (Issue #8.1 – 7/8/16)

Inferno Italiano

One Firbird in the Flames

  • Non-performing loans at Italy’s 10 largest banks swamp equity capitalization 9 to 1
  • Italian bailout fund Atlante needs its own bailout… for a third time
  • Multiple European regulators now shuffling the deck chairs but bonds still afloat
  • Deep value equity buyers risk deep disappointment, with one critical exception

“The Italian government is in a dialogue with the European Commission on how to apply the stabilization framework to these specific circumstances…” says Klaus Regling, CEO of the EU Stabilization Fund. “I am sure they will find a way.” Yes of course they will. European Central Bank President Mario Draghi famously assured us “whatever it takes” in 2012, having since saved the far less systemically relevant Greek and even Cypriot banks. Countries don’t let entire banking sectors go out of business, but if you’re looking to buy, I’d advise Allegro Non Troppo… not too fast.

Italy’s banking sector has been teetering on the brink of insolvency for many months, though not until #Brexit highlighted the unwillingness of healthier countries to keep footing the bill did the Italian banking stocks truly implode. The poster child for ill-health and under-capitalization is Italy’s third largest bank by assets, Banco Monte dei Paschi di Sienna (BMPS IM). Over a quarter of its assets are classified as nonperforming, and the stock now trades for pennies. NPLs have completely overwhelmed Italian bank balance sheets, and on average, NPLs exceed market cap by 9.91 times. (Note I’ve also highlighted fifth largest, Mediobanca. Its 1.51% ratio of non-performing loans to assets is consistent with the U.S. average of 1.59%. We’ll get to tour “Firebird” in a moment.) First, the pain.

Italy’s Bleeding Banks

Top 10 Ranked by Assets (billions)

InfernoItaliano 3 Italian Banks Hurt
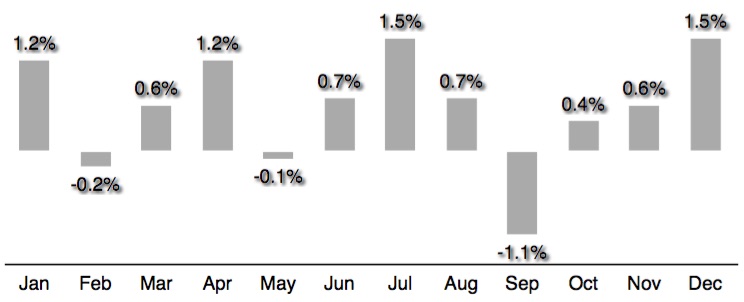
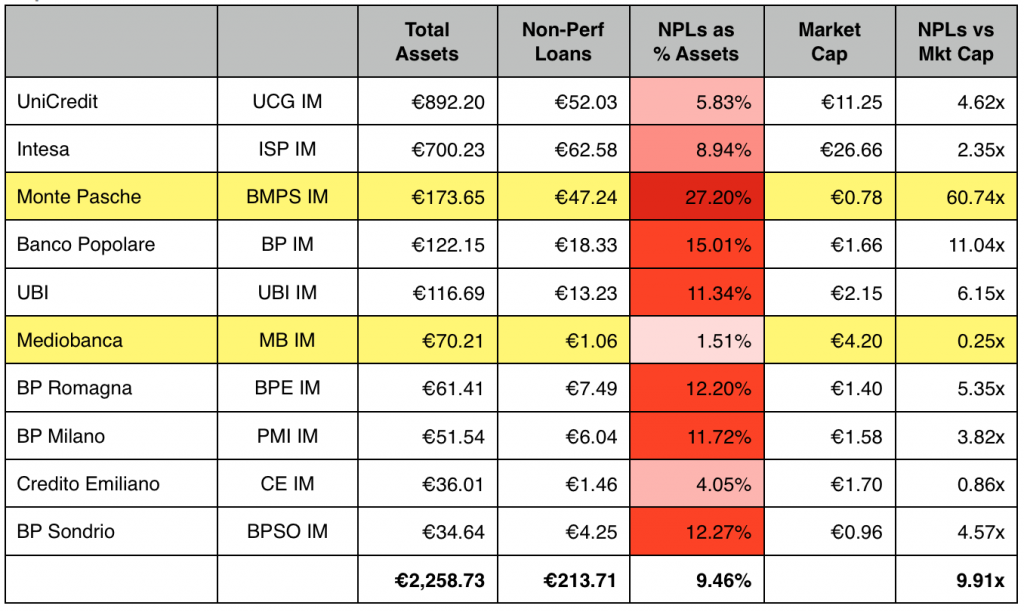
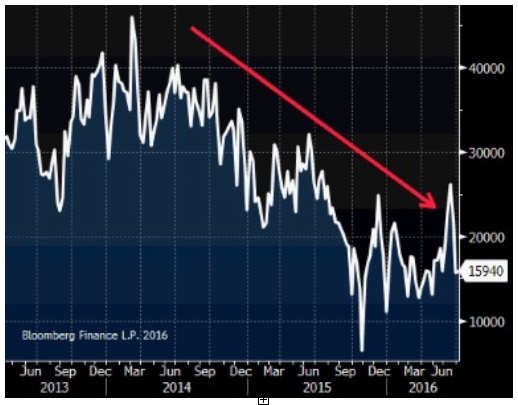
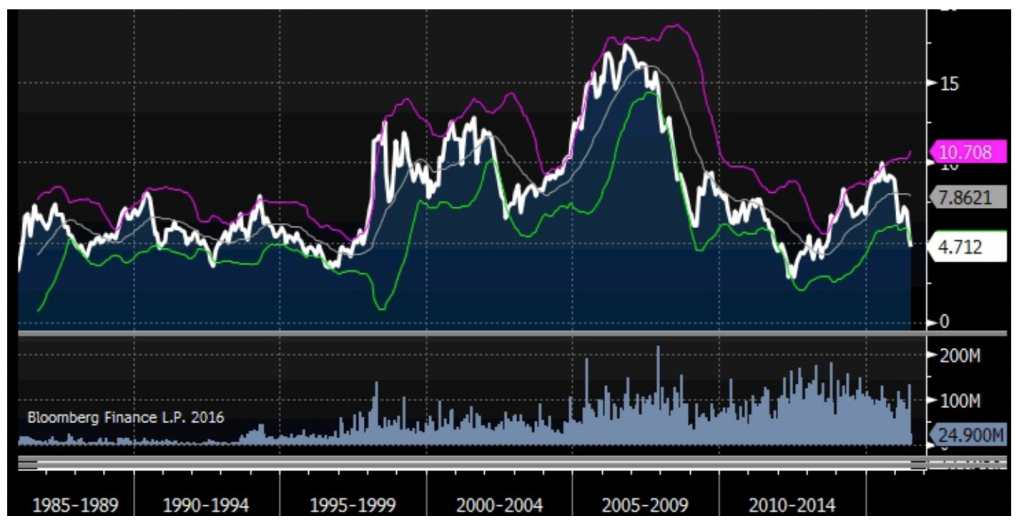
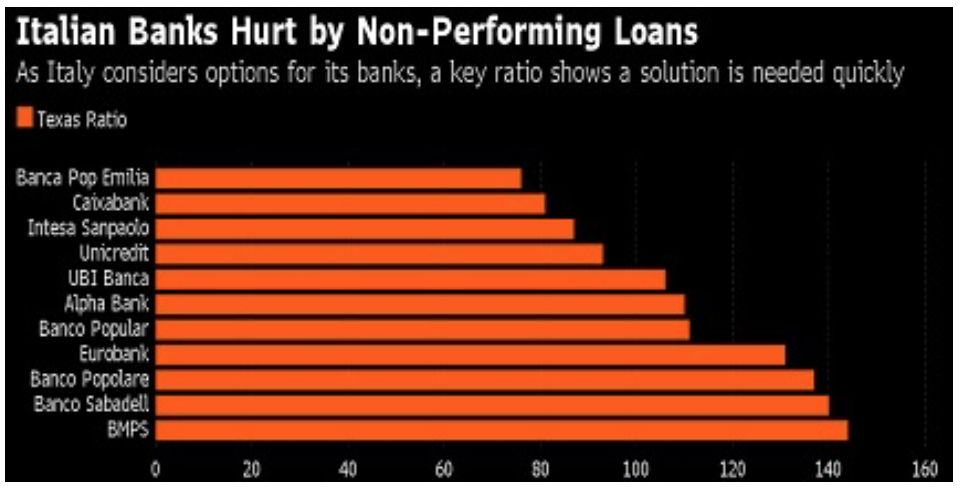
Italy’s banks desperately need recapitalization. In addition to NPLs as a percentage of total assets, regulators also consider something called the Texas Ratio, which is defined as NPLs divided by tangible common equity plus loan loss reserves. It measures the extent to which a bank’s capital cushion has been overwhelmed. Any number above 100 is considered highly problematic, and this Bloomberg chart clearly illustrates Italian banks have exceeded their cushion in stunning fashion. Poster child BMPS is on the bottom, appropriately.

While Q1 filings for the 10 largest banks indicate NPLs of 213 Euros, Italian regulators peg total sector NPLs at 400 Euros. The bad news here (beyond the obvious acceleration over several months and likely underestimation by “audited” figures from March) is that the country’s privately administered bailout fund doesn’t have enough capital to cover the bailout. It’s called the “Atlante” fund, which is Italian for Atlas… a curious choice given the Atlas Mountains and implicit “mountain of debt” metaphor. It’s capital of roughly 4.5 billion Euros equates to 1/100 of the theoretical total of NPLs on Italian bank balance sheets. As a result, the European Commission has authorized the Italian government to provide guarantees on 150 billion Euros of NPLs, though that’s still less than half the total of 400 billion. Oh, and Italy’s Debt to GDP is already 133%. Madonna!

Scuzi… Now What?

Curiously, Italian bank equities tell one story, but the bonds tell another. Consider poster child BMPS IM. While the stock has fallen to about ¢0.30 Euros, reflecting tangible common equity worth less than NPLs (ie insolvent), the bank’s 47 billion Euros of debt trade significantly higher (Bloomberg/BoAML quotes)

• 22 secured bond issues due July 2016 through November 2025 currently yield 0.52% to 1.31%
• 132 unsecured bond issues due July 2016 through May 2021 currently yield 4-7%

Only do subordinated bonds (8 issues 13.89% avg) and junior subordinated bonds (6 issues 34.26% avg) reflect the stress of the situation. Note, many of these bonds trade infrequently, marks are indicative only.

InfernoItaliano 4 HandelsblattIn other words, some of the bond holders will get less than others, but no one is going to get totally shafted. Remember, even Greek and Cypriot banks got bailed out. The European Central Bank, the European Commission, the International Monetary Fund, the EU Stabilization Fund, Germany’s Bundesbank and every other governmental agency is in on the game. They don’t call him Super Mario for nothing.

As for Wall Street’s take, Morgan Stanley writes “If done successfully, this could be a major catalyst for the banking sector in Europe, not just Italy. Citigroup and Mediobanca have run their own stress test scenarios, and while not quite as sanguine, the point is their analysts are trying to quantify
downside because their customers and portfolio managers sense another ECB bear hug. People want in.

Good Business, Bad Zip Code

I am generally NOT inclined to jump in and trust Ceasrus Draghius et. al., but one Italian bank in particular may offer value: Mediobanca (MB IM). As already noted, its reported NPLs as a percentage of assets are 1.51%, less than the U.S. average assuming its figures are accurate. The bank has reported 11 consecutive positive earnings quarters, 8 of which showed growth YoY. As a result, it’s profitable and trades at a modest P/E of 7.05x 2016 estimated earnings. Price to tangible book value is just 0.49x, and its Tangible Common Equity Ratio is a healthy 11.95%. In addition, 9 of 13 analysts rate it a BUY with a target of 8.15 (73% upside). It also pays a 5.3% dividend. Here’s how these figures compare to peers:

InfernoItaliano 5 Mediobanca

History indicates Mediobanca has generally been a buy below $5. I am inclined to agree, though I would also add allegro non troppo… not too fast. Go gently.

Mi Amore?

Mediobanca (MB IM)

InfernoItaliano 6 Mediobanca (MB IM)

Chasing Alpha (Issue #7.3 – 6/24/16)

Chasing Alpha

Six Factors Matter Most Now

  • Many of the 50 largest U.S. stocks trade significantly below all-time highs
  • Leadership is pivoting as equal weight indicies outperform cap-weighted indicies
  • Growth oriented companies dominating traditional value plays
  • Return attribution analysis points to late-cycle themes as drivers of outperformance


America’s biggest companies aren’t pulling their weight. The ten largest components of the S&P 500 Index are down an average of 16.5% compared to their all-time highs… and it’s not just Apple. Google (ok Alphabet) is off about 12% since printing a top back in December. General Electric promises to “Bring Good Things to Life” but its stock still sits 49% below the high 16 years ago. Similar story AT&T. These stocks have been real dullards for a long time, in spite of ranking as some of the largest and most widely help companies in the world. Hmmm, at least they pay dividends.

Leadership 2 Apple
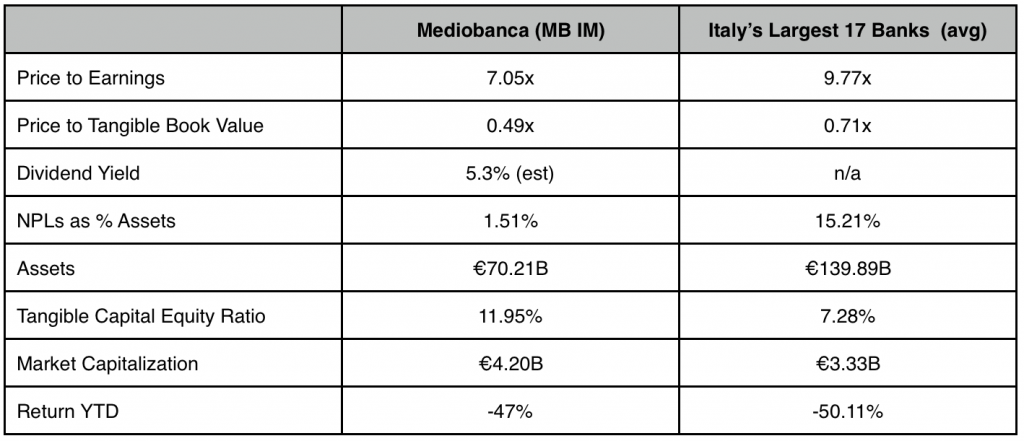
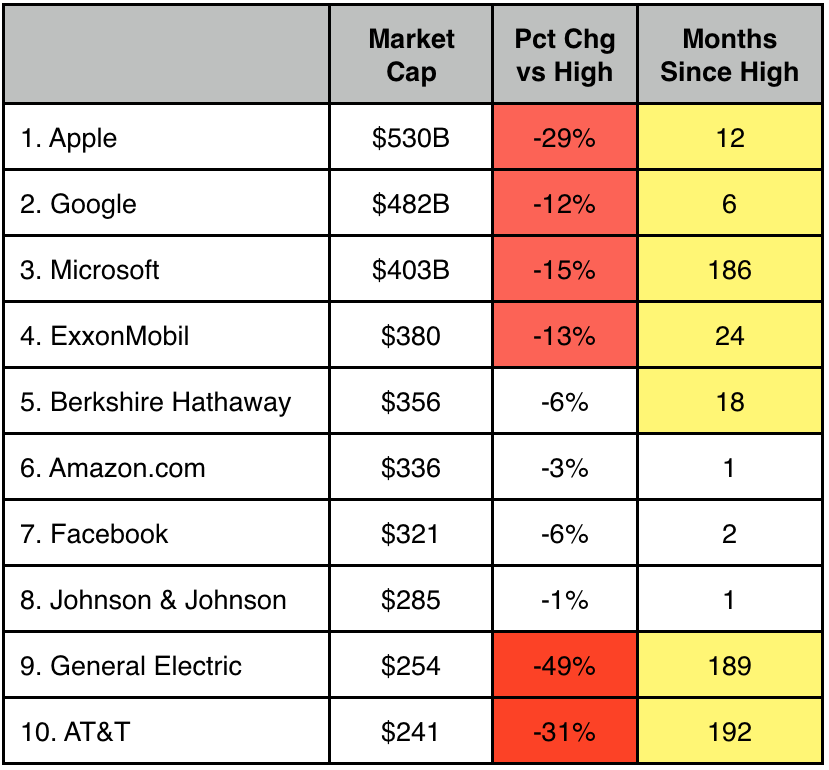
Amazon and Facebook have managed to buck the trend, but leadership among the “leaders” has been hard to come by. I show the ten biggest S&P 500 stocks by market cap to illustrate the point. Again, this group is down an average of 16.5% from individual all-time highs, and those highs were recorded an average of 64 months ago. Patience is a virtue. Or torture. Look at Microsoft. It peaked 186 months ago, but still sits 15% below the peak. It may be the third largest company in the U.S. but it hasn’t exactly produced
capital gains for its legions of investors. Then again I shouldn’t be too hard on Mr. Softy. Broadening the sample to include the largest 25 or even 50 components only underscores the point. Current marks are off 16% and 19% respectively, compared to all-time highs. Big stocks are a big disappointment.

You can see how weak performance by the largest stocks has taken its toll on the S&P 500 Index, which is weighted by market capitalization. It lags the equal weighted version of the index by 176 basis points.

Falling Behind

My friend Chris Verrone of Strategas Research Partners keeps a running tally of how many trading days have elapsed since the S&P 500 Index last made a new high. As of Friday June 24, the count is 275, which he says is the third longest period on record since WWII. To find longer period of consolidation — which I’ll describe as sideways action marked by a lot of impatient portfolio managers lamenting “nothing works” –you’d have to go all the way back to 1983/5 (323 days) and 1959/61 (374 days). The fourth comparable period occurred 1994/5 and lasted 259 days. So this current period of malaise has just moved into the third spot. Critically, Chris notes that markets erupted higher when they did eventually break out, rising 11-36% over the following 12 months. Hope springs eternal.

New Leadership

The inability of mega-caps to lead this market higher, and their erosion in performance relative to smaller companies speaks to a change in leadership. The operative question is: So who’s leading now… and what do we buy?

The one word answer is Energy, which accounts for 8 of the 10 top performing companies in the S&P 500 this year. The group is bouncing from extremely depressed valuations as noted in my “Friends in Low Places” write-up from late May. If you bought those names a few weeks ago, you’re up 5-10%. Stay long.

Looking beyond sector selection, we can figure out which factors matter most right now by slicing the data with the help of a Bloomberg terminal. As an example, let’s say we want to quantify the impact of superior earnings growth on stock performance. Sounds obvious right? Here’s how we actually prove it numerically:

• Rank the S&P 500 constituents by earnings growth and segregate the highest 10% (top decile)
• Compare the performance YTD of this subset to the broader market
• If stocks with the highest earnings growth are outperforming, clearly it’s a relevant to stock selection
• Repeat the process for other key metrics (Low P/E, Sales Growth, etc)
• Compare performance by factor to determine which ones matter most this year

What’s Driving Returns in 2016

Performance YTD by Factor (Top Decile)

Leadership 4 Performance YTD by Factor

We can see the fifty companies in the S&P 500 Index with the highest ratio of Capital Expenditures to Sales (top decile) are up 20.66% this year. In other words, the market is rewarding companies which invest in their business at a higher rate than their peers. The market is sending us a clear message to prioritize higher rates of capex as we make our stock selection. The second most important factor is rising earnings estimates, which is somewhat more intuitive than increased capex I admit. So is actual earnings growth, the third most important factor. Curiously, value is underperforming this year. Stocks with low ratios of price to earnings and price to book are actually down this year.

The real point of this exercise is to better understand where we are in the economic cycle. In 2010, stocks were cheap and the market rewarded PMs for buying undervalued companies. Today growth is harder to find, and the market is placing a premium on those companies which are growing faster. It’s also rewarding companies for investing in their businesses, on the assumption this will drive earnings growth in the future. This is much more of a late cycle orientation and it coincides with several years of economic expansion, even if said growth is somewhat slower than we all might like #JanetYellen.

What to Buy Now

We can apply the top four ranked factors to the S&P 500 Index as a screen in order to position our portfolios for growth in the second half, especially if we get the kind of lift-off implied by Mr. Verrone’s work analyzing breakouts.

Incorporating the conclusions of my factor analysis, I screened for companies with above average capex as a percentage of sales, rising consensus estimates, minimum 5% earnings growth, and dividend yields of at least 2.5%. 18 companies met my criteria, and collectively they are up nearly 15% YTD, about 5 times the return of the S&P 500. These stocks are clearly in the “sweet spot” of what the market is rewarding most right now.

AvalonBay Communities, Inc. (AVB), Centerpoint Energy Inc (CNP), CMS Energy Corp. (CMS), Essex Property Trust, Inc. (ESS), Extra Space Storage (ESR), General Motors Corp. (GM), Iron Mountain Incorporated (IRM), L Brands, Inc. (L), The Macerich Company (MAC), McDonalds Corp (MCD), Nextera Energy (NEE), Oneok Inc. (OKE), PG&E Corp (PCG), Public Storage (PSA), Teco Energy (TE), WEC Energy Group (WEC), Xcel Energy Inc. (XEL), YUM! Brands Inc. (YUM).

Note: If you read my note on real estate “over development” you know I am negative on hotels. In addition, two weeks ago I also expressed caution on homebuilders, though I like home furnishing companies MAS and MHK. This screen produced several REITs, which I admit causes me some agita especially AVB and MAC. I’m less concerned with the storage companies (ESS, EXR and PSA). I left all five in the report to honor my methodology, but would not necessarily buy them.