Last Tree Standing (Issue #4.3 – 5/13/16)

Last Tree Standing

One Lender Still Faces the Axe

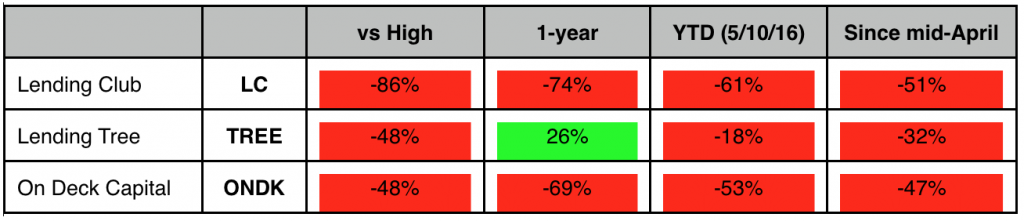
  • Online lenders cut in half since April will NOT recover
  • Four governmental regulatory bodies now examining marketplace loan practices
  • Bloated cost structures undermine the legitimacy of top line growth
  • Lending Tree (TREE) will fall to the forest floor like its competitors

Marketplace lenders were supposed to transform borrowing the way Priceline (PCLN) transformed travel, uniting buyers and sellers on a common platform so they could agree on a price and consummate a deal.

There is only one problem: The concept is failing in spectacular fashion. During the first two weeks of May, On Deck Financial, Inc. (ONDK) lost double the estimate for Q1, LendingClub Corp. (LC) fired its CEO for selling $22M of loans which failed to meet investors’ criteria, and underwriters at Goldman Sachs and Jefferies suspended pending loan securitizations. Only Lending Tree (TREE) still stands… barely. All ten analysts rate shares a Buy, but no tree can withstand gale force winds indefinitely.
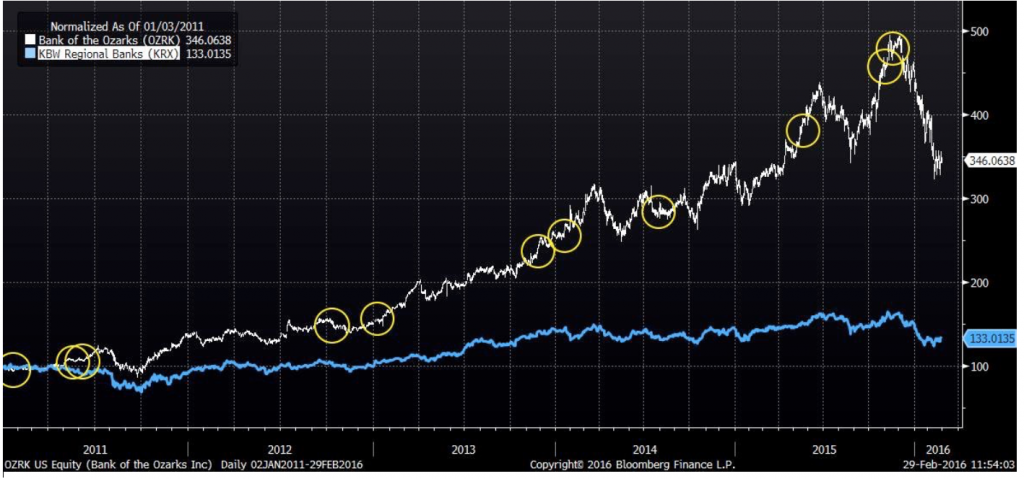
Relentless Selling

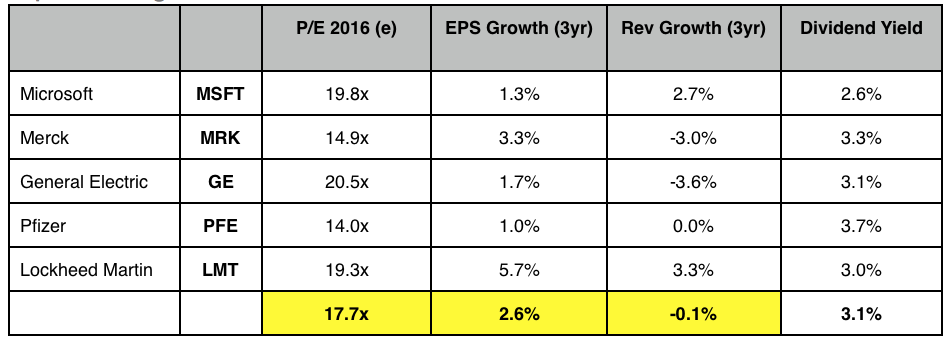
Which of these is not like the other?

TImber Relentless Selling

If a tree falls in the forest, and no one’s there, does it still make a sound? Answer: Yes, just ask the regulators. Four governmental agencies are now examining the business of online lending, and their prying eyes are sending tremors through the industry. The Federal Trade Commission recently joined Treasury, the FDIC and Elizabeth Warren’s Consumer Financial Protection Bureau in trying to better understand whether consumers might be unwittingly opening themselves up to predatory lending practices.

This bad for anyone still long Lending Tree, as Government tends to have a heavy and indiscriminating hand. Former American Banking Association President Frank Keating told me regulatory changes created by Dodd-Frank legislation “raised operating costs for traditional Main Street lenders by an average of 17%, even though they have nothing to do with capital markets.” Sadly for the marketplace lenders, their business models have everything to do with capital markets, as secondary loan securitization is essential to recycling capital and generating earnings growth.

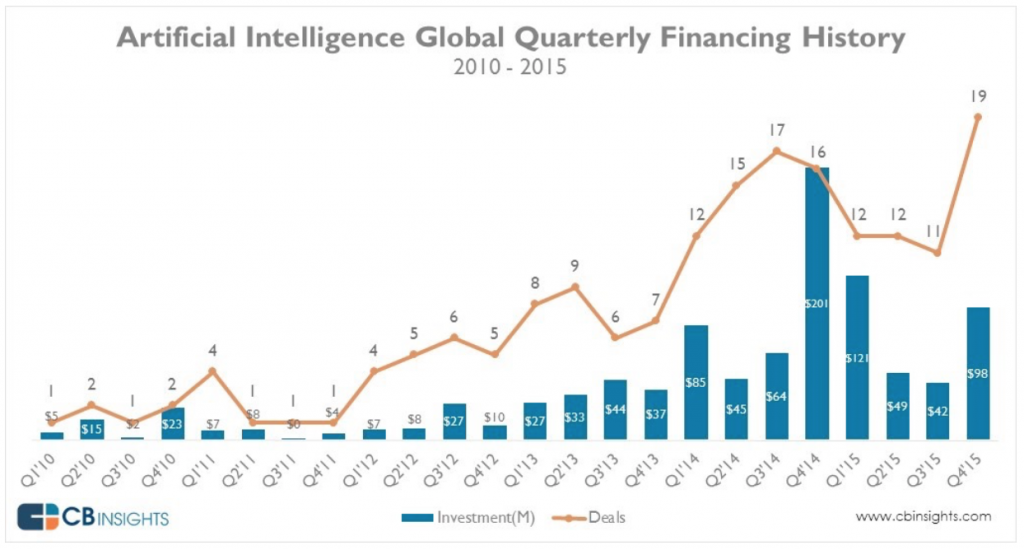
Now, before we get too bogged down by the negatives (though we’re getting there quickly) let’s start with the noble promise of making more credit more available to more people. Just as companies like Uber and Fresh Direct have harnessed connectivity to enhance fulfillment and customize choice, FinTech innovators have created a number of new platforms to connect consumers and capital more directly. As a result, total online loan origination rose to $37B in 2015, up from virtually zero in less than five years, according to Autonomous Research.

Dozens of private lending companies with names like Rapid Advance and Multifunding LLC now compete online to offer loans with significantly less friction than traditional underwriters. Many of their processes are automated by algorithms analyzing digitized documents on servers far away from expensive branch offices, meaning they can process loans faster and at lower cost than traditional banks. Often, borrowers get approved the same day they apply, and funds are wired within the week. These so-called marketplace lenders have prospered by stepping into the void left by banks still repairing balance sheets after more than $1.1T of write downs since 2008.

On Deck estimates $80-120B in demand for small business loans went unfulfilled in 4Q16, compared to actual loan volume of $193B. So On Deck has been busy writing business, but as the recent earnings miss demonstrates, buying business at the margin can be very expensive. Loan loss reserves rose and securitization fell, which is a double whammy. Loan quality is falling so fewer people are willing to buy the company’s loans in the after market. To quote J.P. Morgan analyst Richard Shane (who rates ONDK a hold):

“The high level of credit risks inherent is ONDK’s high yield portfolio remain difficult to assess given the company’s reliance on its proprietary algorithm for determining credit risks. As credit risk management is critical to sustaining ONDK’s robust growth, we remain watchful with regard to the effectiveness of its credit assessment algorithms.”

On Deck uses use its own capital to make loans, so its position and opacity make it particularly problematic, which is also why it’s a single digit stock. Lending Tree, by contrast acts as a neutral or third party marketplace, introducing borrowers and lenders. Even so, Lending Tree still faces multiple challenges.

Timber Quarterly revenues
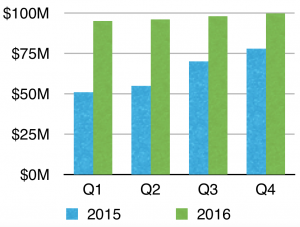
1. Flat Quarterly Revenues
Lending Tree’s top line has gone from Growth Miracle in 2015 to Miracle Gro wanted in 2016. Whereas last year’s revenue rose from $51M in Q1 to $78M in Q4, management recently guided analysts to $95M per quarter this years… for all four quarters. When an exasperated analyst f rom BWS Financial exclaimed, “$95M per quarter for all four quarter means zero sequential growth” the CEO responded “I need to look at the numbers.” So here they are in green, ironically: Zero sequential growth.

2. Extremely High Costs
Anyone who follows Amazon knows that on-line profit margins can be notoriously thin, so thin that supermarkets at 2-3% actually look robust! Welcome to the world of online lending. In theory, operating a marketplace without the burden of branch offices along Main Street should be cheap. It’s not. Customer acquisition is EXTREMELY expensive. Lending Tree spends 59% of revenue on advertising. Lending Tree’s total SG&A expense (Sales, General & Administrative) equates to 80% of total revenue, the second highest of all 1500 stocks in the S&P 1500 Index. Think of it this way, Lending Tree spends 80 cents to make 20 cents, meaning there’s very little room for error. Do YOU want to be in that business?

3. Expensive Middleman
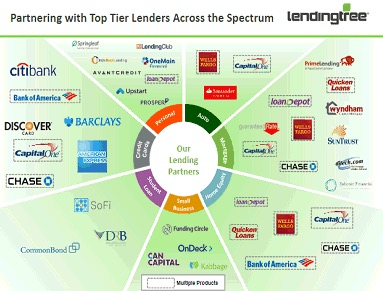
Lending Tree proudly highlights it lending partners in the company presentation. Wells Fargo figures prominently in several categories, as it should… accounting for about one in five mortgages in the U.S. But does Wells Fago really need Lending Tree? It’s already Goliath. And why should lenders like Chase and Citi pay 50-400 basis points per loan for customer introduction? Curiously, On Deck is a Lending Tree customer. So is SoFi, which pitches itself to Millenials in need money as “awesome” and describes markets as “weird.” I remember when institutional stock brokers charged 12 cents/share, and now it’s less than a penny. Real estate brokers once collected 10%. Disintermediation works when process is simplified and cost is lowered, not when a new layer is inserted. Sorry Lending Tree, you are not mission critical.

Timber pic2

4. People as Product

I suspect we will learn over time that the four regulatory agencies examining Lending Tree will express concern over fundamental conflicts of interest inherent in the structure of its business. The key issue is its definition of Customer. Per the original S-1 registration document filed with the SEC in 2008:

Access to Supply: Tree.com provides lending and real estate network partners with important customer acquisition channels. Tree.com believes the ability of its partners to reach a large qualifies audience through its brands and businesses is a significant benefit. Tree.com com offers customers the choice of multiple suppliers in one setting.

This paragraph clearly identifies banks are partners of Lending Tree, using the online platform for “customer acquisition.” Several questions arise:
• But does this imply the borrowers are product, or are borrowers customers?
• Are banking partners also customers?
• Can a market place fairly represent both sides without providing total transparency, especially when proprietary algorithms process the data?
• Should we interpret “multiple suppliers” as the banks supplying capital or the borrowers supply

I offer no answers, but I am confident that dozens of lawyers laboring at four agencies can create enough uncertainty and overhang to pressure this sector for a long time. Regulators strung out the debate over for-profit college loan abuse for several years. Similarly, banks are still settling suits from 2008, and even BP is not clear of its 2010 oil spill. This debate will drag on for years.

Bottom Line: Lending Tree is a long-term, structural short position. It’s growth has slowed, its costs are high, it may ultimately prove less relevant to existing partners and regulators have dug in.

Lending Tree will also prove a challenging position to trade for two key reasons: The company has expressed considerable interest in buying shares in the below $70, as it did during the February sell-off; and short interest exceeds 40% of float, meaning it could be subject to a massive short cover rally. That said, the long-term chart clearly indicates a deteriorating trend and plenty of room to the downside.

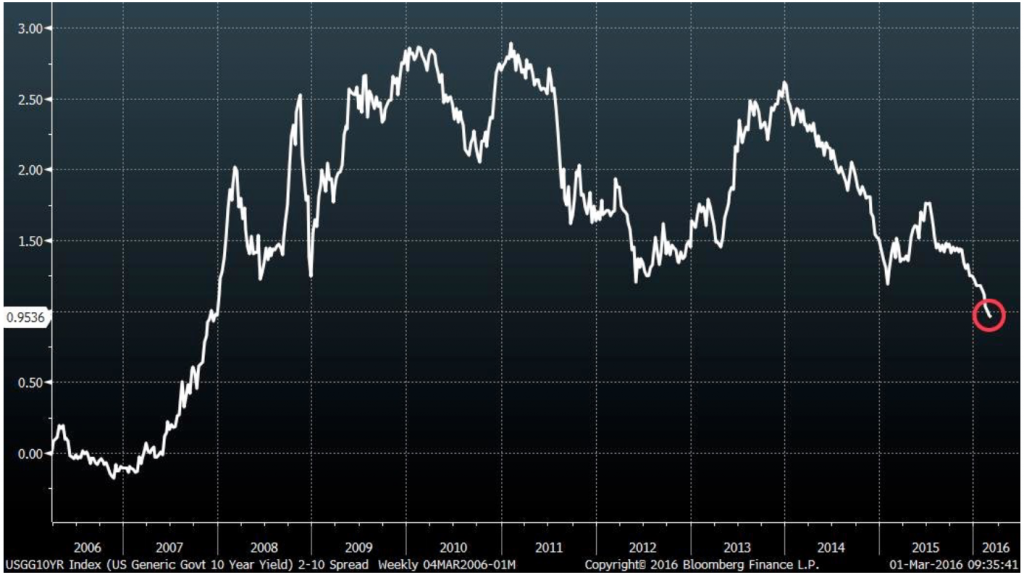
Lower Highs & Long Way to Zero

Lending Tree (TREE)

Timber graph

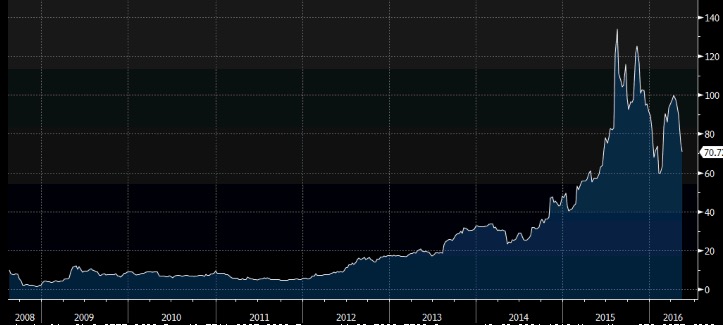
Copyright 2016 Bloomberg Finance L.P.

Culture Club (Issue #4.2 – 5/13/16)

Culture Club

15 “Best Places to Work” … and Own

  • Companies prioritizing people significantly outperform the S&P 500 Index
  • Cutting employee turnover in half improves operating budgets up to 6%
  • Seven Secrets to inspire, motivate and retain talent
  • The man who humanizes money management https://www.youtube.com/embed/dumAFMBisSo


Fortune Magazine publishes its annual ranking of 100 “Best Places to Work” and wealth management firm Edward Jones makes the list for 17 years running. We expect places like Google to attract accolades –with free gourmet lunches, onsite laundry service and lego play rooms– but a place where you buy life insurance and fund a 401(k)? Admittedly we were surprised, especially since the firm had made the cut so many times. Then Fortune invited us to meet the person at the helm of this decades old partnership, Managing Partner Jim Weddle (link to interview https://www.youtube.com/embed/dumAFMBisSo). We soon realized Jim is not only doing something right, but knows exactly what he’s doing.

Jim joined the company back in the 1970s, fresh out of business school. He admits his work ethic was “pretty good but still needed encouragement from time to time.” So a senior partner quietly took Jim under his wing, and within a couple years asked him to open a new office in rural Indiana. Jim prided himself on knowing the name of every client who walked in the door and always having a fresh pot of coffee in the pantry… generally starting at 6am. Several years later Jim was asked to oversee the entire retail network. Today Edward Jones has over 11,000 locations.

Jim’s small town charm has produced big time results, in part because he’s figured out how to quantify a culture and implement at scale. Fortune tracks these metrics to determine its annual ranking of Best Place to Work. So does Bloomberg, in its own version called a Social Disclosure Score. SDS measures factors like employee turnover, gender equality, and corporate governance. As we can see from the data, SDS has as much impact on shareholders as employees.

Nice Guys Finish First

SDS Portfolio Outperforms

Based on rebalancing the portfolio every six months and back testing over a ten year period ended March 31, top-ranked SDS companies significantly outperformed the broader market, returning 165% compared to 97% for the S&P 500. Whether looking at Fortune’s ranking or Bloomberg’s data, the point here is obvious: Positive culture is positive for shareholders.

While Bloomberg’s SDS ranking is based solely on numerical measures, Fortune’s methodology merges qualitative information with quantitative data. We counted 51 separate categories on which companies are judged, not to mention hundreds of written responses from surveyed employees. For those of us who generally opt for data over anecdote, and yet still appreciate the softer side of due diligence, this approach is very satisfying. Fortune’s process is exceptionally rigorous. In broad terms, Fortune’s criteria integrates two parallel data sets:

  • Trust Index Employee Survey (67%) asks a random sample of employees to rate multiple factors like management credibility, job satisfaction, and co-worker camaraderie.
  • Culture Audit (33%) measures specific metrics like compensation, benefits, turnover, hiring practices, methods of internal communication, training, recognition programs, and diversity efforts.

Turnover says a lot about a company’s culture, and the Fortune team notes the 100 Best Place to Work 2016 have half the turnover rate of non-ranked companies. In the notoriously volatile hospitality industry for example, 46% of employees leave every year, compared to just 21% for related companies which made the Fortune list. Accounting for the resulting loss to productivity, a 2006 white paper co-written by PricewaterhouseCoopers and the Saratoga Institute estimates resignations cost companies 90-200% of the departing employee’s base salary, ultimately adding 12% annually to enterprise operating budgets. By implication, cutting turnover in half reduces overhead by 6%, which in turn boosts margins and net income. So Fortune digs deep to figure out what keeps people loyal. Here’s Fortune’s take on Connecting People & Purpose: 7 Ways High-Trust Organizations Retain Talent.

CultureClub Define Your Company's Purpose

At Edward Jones, the formula includes a powerful combination of mentoring, regular video town halls, generous incentive rewards, a priority on long-term growth over short-term metrics and a compelling sense of mission. As Jim told me, “What we do matters… and private partnership creates collaboration that supports robust mentoring across our firm… it’s also a significant strategic advantage. We are able to make decisions with a longer-term horizon.

Having worked at both large public companies and small private partnerships, we agree wholeheartedly. Non-public companies can afford to take a longer-term view towards people and productivity. There’s only once catch: We cannot invest in private companies. So we consider only those 35 companies on Fortune’s 100 Best Place to Work which are public, narrowing the list to 15 based on our own criteria.

I’ve highlighted in green those companies with positive cumulative returns since joining the index, as well as those which have outperformed the S&P 500 over the same period. Underperformance by either measure is noted in red. Additionally, we’ve highlighted in yellow those companies whose 2016 earnings estimates exceed 10% AND whose returns are positive by both measures.

CultureClub Company ranking table

We observe the following from the data:

  • 29 of 35 public companies currently ranked by Fortune have returned positive results for shareholders while on the list of 100 Best Places to Work.
  • 25 of the 29 have also outperformed the S&P 500 Index during the same period.
  • On average, current public companies ranked have made the list for 9.2 years.
  • The average cumulative return for these companies while on the list has been 175%.
  • Average outperformance compared to the S&P 500 Index has been 121%

While I would never buy a company simply because it has made Fortune’s list of 100 Best Places to Work, the data clearly illuminates the correlation between positive corporate culture and superior stock performance over time. An impressive 71% of public companies currently ranked by Fortune (25 of 35) have outperformed the S&P 500 Index while on the list, and the margin of outperformance has been significant.

I chose to highlight in yellow the 15 companies with 2016 earnings growth estimates exceeding 10% because growth is especially hard to find in the current environment. In fact, S&P 500 earnings for Q1 will likely constitute a third consecutive quarterly decline, the longest stretch since 2008. So we are being particularly narrow in our focus. We want culture AND we want results.

Culture and Growth

12-mo Returns through Q1

CultureClub 12-mo Returns through Q1

Of the fifteen “10% Growers” highlighted in yellow, we note 9 have posted positive returns for the 12 months ended March 31, 2016 while 6 have declined. The average return for the group of fifteen is 6.1%, compared to a decline of 2.1% for the S&P 500 Index.

Free the Groundhogs (Issue #4.1 – 5/13/16)

Free the Groundhogs

9 Stocks Behaving Like Bonds

  • S&P 500 valuation exceeds 50-yr average in spite of significantly lower earnings growth
  • Only 15% of companies in the Russell 3000 are rated Investment Grade by Moody’s
  • Traditional income funds currently offer poor risk/reward vs. long-term metrics
  • Dividends have accounted for nearly half of stock market return since 1990

Bonds have become the new stocks. In our upside down world of negative interest rates, where the IMF lowers its global growth forecasts every six months and U.S. corporate earnings will likely decline for a fourth consecutive quarter, sovereign bonds keep rising. Stocks meanwhile go nowhere. The U.S. 10-year note has now risen 30 points above par, while the S&P 500 has hugged 2,000 for two years. To escape this Groundhog Day of mind-numbing repetition we need to adjust our playbook. If Bill Murray can break the spell AND get the girl, so can we. Time to start looking for stocks that act more like bonds.

I may sound facetious, but I’m actually quite serious. The team at Strategas Research first alerted us to this notion of stocks acting like bonds, and we agree with their thesis of focusing on steady income at this point in the cycle. It’s not just that bonds are rising and stocks are stalling. It’s also that dividend streams from stocks start to look a like coupon payments from bonds when stock prices stop rising. In other words, potential capital gains may be few, but prospects for current income are still attractive.

Okay, I recognize bond analysts tend to get a bad wrap, lawyerly types who wring their hands over the contingent liabilities and seniority in default. In fairness, they’re just counting cash flow like the rest of us, and stock jocks would be well served to focus more on money and less on moonshot. Ten-baggers are tempting but hard to find. While Bloomberg’s IPO Index has fallen 19% over the past year, dividends continue to add up. Since 1990, dividends have accounted for 47% of total stock market return. The wealth may take longer to accumulate, but it accrues consistently.

For the Love of Money

Cumulative Returns Since 1990

Admitedly there is a catch. Some of the best known dividend funds have failed to keep up. Take the venerable $96B Income Fund of America (AMECX) for example, which practically wrote the book on dedicated income funds when it launched in 1973. The fund has lost 6.15% for the 12 months ended 4/10/16, significantly more than the 1.45% decline for the S&P 500 Index… in spite of paying a 3.2% dividend yield. What’s worse, the fund charges 5.75% when you buy, 1.00% as you sell and 0.22% each year of ownership. If you bought last April and just decided to bail, you are down 13.12%.

Income Fund of America currently holds over 1,600 separate positions, and the top five holdings (12.4% of assets) illustrate why it struggles to make headway. Simply put, valuation is high and growth is low.

Bad Combo

Top 5 Holdings at AMECX

GroundhogDay Top 5 Holdings at AMECX

I appreciate the 3.2% average dividend yield of these five companies, but “coupon” is only part of the story. When we say we want stocks which act like bonds, they need to pay dividends AND offer enough upside that capital gains are a reasonable aspiration. Bonds have been able to eek out gains because the underlying fundamentals –minimal inflation and accommodative monetary policy– continue to provide consistent tailwinds. By contrast the stocks noted here offer very little runway. We simply cannot argue in favor of high teen multiples when growth is virtually non-existent.

Lest you think we’re picking on AMECX, the same state of affairs applies to the broader market as well.

Stocks Cost More…

GroundhogDay PE Ratio

But Growth is Anemic…

GroundhogDay Earnings

And Dividends are Lower…Ugh!

GroundhogDay Yield

The point here is we need a new strategy. We cannot continue to blindly step out of our holes in search of shadows and expect winter to go away. Ms. Yellen and her European counterparts will continue repressing rates, holding assets aloft and income streams down. So we are creating our own income fund, screening Russell 3000 Index components for that elusive combination of yield, growth and value:

  • Senior Unsecured Debt rated Baa or higher
  • Forward 12-month P/E ratio less than 15x
  • Forward 12-month earnings growth estimates greater than 5%
  • Forward 3-year projected dividend growth greater than 0% (Bloomberg model)
  • Minimum dividend yield of 3.0%

Better, Stronger, Faster

Stock Screen Results

GroundhogDay Stock Screen Results

Only 9 stocks made our screen –from an initial field of 3,000– because I purposely made the criteria highly restrictive. As the current bull market enters its 85th month, well past the average of 59 months following recessions since WWII, we think high quality companies matter now more than ever. In fact, narrowing our field to just investment grade companies eliminated 85% of the index before we even considered earnings, yield and valuation… an amazing statistic in and of itself!

The figures above show this group of nine companies offers significantly better risk/reward than the broader market. We also note an average beta of 0.96, meaning they are less volatile than the market. In addition, the group has returned nearly 4% as of mid April, double the return of the S&P 500 Index.

Consistency may be hard to find, but it’s out there… just ask a groundhog.

Thank You Uncle Sam (Issue #2.3 – 4/15/16)

Thank You Uncle Sam

How to Maximize your 401(k)

  • Compounding and dividend reinvestment significantly enhance 401(k) returns
  • Outperform after-tax accounts nearly two-fold over long-term holding periods
  • Second quintile dividend stocks offer the best risk-adjusted returns
  • Six stocks to buy now

American illustrator J.M. Flagg created his iconic image of Uncle Sam for Army recruiting posters in 1917. He effectively painted himself wearing a top hat and borrowed the nickname from a legendary U.S. Army meat supplier from the Battle of 1812, whom troops affectionately called “Uncle Sam” for stamping US on bags of rations. Today pork has replaced steak as Washington’s meal of choice, but there’s still one particular feast every American deserves: tax-deferred compounding and 100% dividend reinvestment in a 401(k) account.

Congress first introduced language on tax deferred savings plans into the Internal Revenue Service Code in 1978, though in true governmental fashion the IRS took another three years to codify treatment and structure for what would become commonly known as 401(k) accounts. By 1983, seven million Americans were on board. Today the number has risen to 55 million and assets top $4.5 trillion, according to the Investment Company Institute.

Now, let’s be clear: 55 million people may sound like a lot, but it’s less than one-third of the working population. Far too many people are ignoring Uncle Sam’s generosity… note the pointed finger. This is red meat for the masses, and everyone has a seat at the table.

401(k) accounts represent the single most advantageous retirement plan available and we should all be participating. Here’s why and how to maximize returns.

For the 2015 tax year, individuals can contribute up to $17,500 of pre-tax income. In addition, companies can make matching contributions, provided the combined total does not exceed $53,000. All earnings which accrue in a 401(k) are tax deferred, meaning no tax is paid until withdrawal, presumably after retirement and therefore at lower rates. Since earnings include interest, dividends, and capital gains, 401(k) returns significantly outperform identical allocations in after-tax accounts. In effect, the government is giving you a loan on all your gains, allowing you to compound the government’s money in the process. Again, this is a very good deal.

To better illustrate the point, consider returns on the S&P 500 Index relative to its Total Return Index, where dividends are reinvested without regards to tax withholding. This is analogous to a 401(k) account. Every time a company in the index pays a dividend, the amount automatically goes towards purchasing additional shares. The Total Return Index assumes taxes and commissions are zero.

Reinvesting Dividends Adds Up

Total Return Index vs S&P 500


ThankYouUncleSam2 Reinvesting Dividends Adds Up

The difference is staggering when seen on the chart above. While an initial investment of $100 in the S&P 500 Index at the beginning of 1990 rose to $580 by 2015, the Total Return Index (TRI) rose an additional 430 percent to $1,010. The reason for the near doubling of performance is twofold: additional shares accumulated over time generate additional return; no taxes are paid on dividend distributions, so more money buys more shares.

Let’s put some real world numbers on this to further prove the point, focusing on the actual 25 year period from 1990 to 2015. We will be very conservative in our assumptions: a.) an individual’s company does not match employee contributions; b.) the IRS maintains its current maximum of $17,500 rather than adjusting upwards for cost of living.

Our base case reflects the actual return of the S&P 500 Index over the 25 year period, including dividend income, but not allowing for any dividend reinvestment. In our 401(k) account by contrast, those same dividends accrue tax-free and are fully reinvested. Plugging actual returns of 8.5 percent and 11.4 percent respectively using Bloomberg data, 401(k) outperformance is self-evident.

Power of Pre-Tax Compounding

S&P 500 Returns (1990-2015)


ThankYouUncleSam2 S&P 500 Returns (1990-2015)

The key here is compounding over time. The same S&P 500 stocks in a 401(k) account produced nearly double the return of 25 years. For all the talk (and effort) to find the next Uber or Apple, buying boring dividend-paying names and reinvesting the proceeds on a tax-deferred basis is a highly profitable strategy.

Now that we’ve got the basics, the question is whether we can further optimize returns through stock selection, and the answer may be yes. The team at Strategas Research looked at the risk-adjusted returns of S&P 500 component stocks sorted by dividend yield. They found risk and reward were maximized when investors bought the second decile of highest yielding stocks (i.e. stocks ranked 61-80% in terms of yield) and rebalanced every 6 months. As their data illustrates, the second quintile produced the highest returns on both an absolute and risk-adjusted basis.

Second Quintile Steals First Place

S&P 500 Index by Dividend Yield (1990-2015)


ThankYouUncleSam2 S&P 500 Index by Dividend Yield (1990-2015)

We are all about maximizing returns, but not at the expense of our sanity. Even in a world of zero commissions, the prospect of buying/rebalancing/reinvesting dividends on over 100 stocks is totally impractical. So as an alternative, we applied the Strategas second quintile approach to the more manageable Dow Jones Industrial Average. The index has just 30 components, all of which pay dividends, so the second quintile totals just six companies.

Backtesting the strategy with Bloomberg Analytics over the maximum period allowable (2000-2015) shows the DJIA second quintile group outperformed the overall DJIA Index by a margin of three to one, returning a cumulative 151% compared to 52%. Additionally, since Bloomberg Analytics can only model dividends paid plus stock appreciation on backward-looking time series, not dividend reinvestment, we would expect actual returns to be higher.

DJIA Second Quintile Dividend Portfolio

As of 12/30/15


ThankYouUncleSam2 As of 12_30_15

For investors looking to replicate our study, or begin putting it to work in their own 401(k) accounts, here’s our methodology:

• Buy the second quintile dividend components of the DJIA as of 12/31.
• Rebalance as of 6/30, and every 6 months thereafter.
• Immediately buy new shares with proceeds from dividend distributions.
• Our study revealed 51% turnover annually, meaning three stocks were typically bought/sold every 6 months.

Semi Hammer (Issue #2.2 – 4/15/16)

Hammer the Competition

One Semiconductor’s Quest to Dominate

  • NXP Semiconductors ranks #1 by sales in its two largest markets
  • Top 10 largest shareholders add to positions in Q4
  • Key executive reiterates Freescale merger synergies
  • CFO to update profitability and growth metrics April 28

“We don’t want to be just number one in the market, we want to be number one and at least 50% bigger than the next guy in the business.”

Strong words indeed, and we admit they catch our attention. We don’t often hear executives raise the bar quite so high, especially in the beleaguered semiconductor industry. Intense competition has compressed operating margins, and research firm IDC estimates growth in 2016 will barley touch 3 percent.

But don’t bother telling Peter Kelly, Exec Vice-President of M&A at NXP Semiconductors NV (NXPI). He’s the man who made the comment at Morgan Stanley’s Tech Media & Telecom Conference in early March. He is also the executive charged with integrating NXP’s recent acquisition of Freescale Semiconductor. The companies merged in December and now control over half the market for secure smart chips used in the auto industry. In that rapidly growing niche, where NXP’s chips work with sensors to enable park assist, automatic braking and lane change alerts, no one else even comes close. NXP also ranks #1 globally in programmable smart chips used on credit cards and inside smartphones to power secure money transfer apps like ApplePay (9.5% of sales). Samsung is also a customer, accounting for 5.5% of sales.

Together, NXP’s dominant auto and consumer franchises account over half annual revenue, estimated at $9.5B for 2016 as the company integrates its Freescale acquisition. This transaction catapults NXP squarely into the middle of the S&P 500 Index, comparable to Mastercard (MA), Lennar (LEN) and Tyco International (TYC).

Still haven’t heard of NXP? You will, and the company is making sure. Nearly the same day Mr. Kelly made his case to attendees the Morgan Stanley TMT conference, several positive developments hit the tape:

• NEC Corp. (6701 JT) names NXP Semiconductors Partner of the Year
• Harman (HAR) teams with NXP to enable vehicle-to-vehicle communication (V2X)
• NXP introduces remotely programmable smart cards which can serve multiple apps
• Drexel Hamilton initiates NXP as a Buy with $102 target (+30% upside)

Wall Street got the whisper ahead of the news, of course. Top ten shareholders all bought shares during Q4 –lots of shares– and critically they are strong-handed buyers with very deep pockets… a CFO’s dream.

Big Names…Big Buyers

Position Change 4Q15

SemiHammer2 Position Change 4Q15


Institutional investors of this caliber buy large blocks because they have vetted the story ad nauseam. Their analysts have inserted themselves into the supply chain and modeled future cash flows. Their portfolio managers have argued multiple opportunities around the table and settled on a select few. Ten thorough investors reaching the same conclusion at the same time speaks volumes.

CATALYST #1: the NXP/Freescale combination creates runway.

First, the combined company will control over 15% of the $26B market for secure, specialized chips used by the auto industry. Second, this market is growing three times faster than the overall semiconductor market according to IDC, 9% versus 3%. Third, the sensor/secure chip architecture in hybrids and driver-assist technologies has significantly higher margins than traditional logic chips, in some cases by a factor of four. Fourth, these smart vehicles require double the number of chips, a total of $200 per vehicle. Fifth, added scale fosters long-term partnerships with key suppliers, providing added earnings visibility for NXP investors.

In addition to reiterating $500M in merger synergies (20% gross margin expansion and 80% cost savings) Mr. Kelly shared the following with attendees at the Morgan Stanley event:

“As soon as we announced the deal, the big OEMs were all over us straight away. They just see this as hugely positive. For them, they’re making a big investment in you as a partner. They know they have to work with you as a partner for 10-15 years. They are delighted to have a big company to work with.”

We will likely hear more from Mr. Kelly on April 28 at the company’s first analyst day since the merger. He told us to expect detail from CFO Dan Durn as to “what our growth targets are, what our gross margin targets are, what our operating margins are… and more importantly how we get there.” We will eagerly await those details. Meanwhile here are some of the figures currently forecast by the Street, including NXP’s closest competitors for both auto and mobile segments (60% of pro-forma sales for 2016):

Key Metrics Beat Key Competitors

Trailing Twelve Months


SemiHammer2 Trailing Twelve Months

CATALYST #2: Rising demand for NXP’s secure smart chips which drive e-commerce on mobile devices.

While mergers grab headlines, STX has an equally compelling opportunity to expand its near-field communication chip business (NFC) on mobile devices through major agreements with Apple, Samsung and Xiaomi.

NXP creates secure chips in smartphones which enable tap-to-pay transactions, think Starbucks lattes with a tap of your phone at the checkout counter. This mobile division was equal in size to Auto prior to the Freescale merger ($1.3B annual revs), and is growing even faster at 13%. The deal with ApplePay accounts for nearly a tenth of NXP revenues, and a recently announced expansion with Xiaomi further enables public transit payments throughout China.

Essentially, these are the next gen chips which first appeared on credit cards in the 1990s as a secure alternative to magnetic strips. That transition solved fraud issues, and now internalizing payment within the phone increases flexibility. Since the phone is connected, chips can be updated remotely, unlike chip enabled cards which have to be replaced. Related applications like electronic passports present additional upside.

In the case of Xiaomi’s new transit app, the goal is to transition 400M users of disposable transit cards to tap-to-pay technology. It’s just one of 108 NXP customers identified by Bloomberg. Based on company filings, Bloomberg Intelligence quantifies such near-field communication (NFC) opportunities as a potential 98.5% CAGR market through 2020, which would still put mobile payments at just 7.1% of total.

Positioning for Growth

Tap-to-Pay Upside

SemiHammer2 Tap-to-Pay Upside

25 analysts cover NXP, 23 of whom rate it a Buy. Collectively, they forecast 35% upside over the next 12 months (average target $104). We agree with their estimation, and we believe 13.6 times earnings is far too cheap given the glide path.


Buy the Buyers (Issue #2.1 – 4/15/16)

Buy the Buyers

Twelve Banks Devouring the Competition

  • Select regional banks driving superior results through strategic M&A transactions
  • Most active acquirers operating far from large, concentrated banking centers
  • Serial acquirers delivering higher net interest margins and earnings growth
  • Strong outperformance in spite of powerful head winds for the sector

George Gleason bought his first bank in 1979 at age 25, becoming both employee #13 and Chairman of a $28 million lender with five branches across rural Arkansas. Dozens of acquisitions later, his Bank of the Ozarks, Inc. (OZRK) is still buying and consistently ranks as one of the most profitable regional banks focused on traditional Main Street lending. Since 2010 alone, he’s added $6.6B in assets. His current bid for C1 Financial (BNK) will expand the franchise into southern Florida, adding an additional $1.5 billion in assets.

American Banker named Gleason Community Banker of the Year in 2010, citing consistent shareholder return and superior profitability. Operationally he focuses on three key drivers: net interest margin; asset quality; efficiency. Recently reported results for 4Q 2015 tell the story. Bank of the Ozarks’ NIMs of 526 bps rank well above the industry average of 337 bps, and annualized charge-offs total just 0.17%, meaning the bank writes down just 17 of 1,000 loans.

The stock has recently suffered from the market sell-off, as well as a lawsuit brought by shareholders of current target C1 Financial, who argue OZRK’s purchase price is too low. Even so, shares have trended higher with the announcement of each transaction. Since the beginning of 2011, shares have appreciated 246%, seven and a half times the Keefe, Bruyette & Woods Index of regional banks.

Growth & Gains

M&A Driving Outperformance

BuyTheBuyers2 M&A Driving Outperformance

While a master of merger integration, Gleason’s roll-up strategy is hardly novel. BofA, Citigroup, JPMorgan and Wells Fargo can all trace the size of their current footprints to multiple acquisitions made since 1990. In the past three years alone, twelve regional banks have kept M&A advisors particularly busy, each buying an average of $265 million in assets every 9 months.

Busy Bankers

Top Consumer Bank Acquirers (2013-Present)


BuyTheBuyers2 Top Consumer Bank Acquirers (2013-Present)

What’s particularly interesting about this group is its ability to post consistent growth and profitability while integrating multiple banks into their own established businesses.

• Net interest margins, the difference between a bank’s return on capital and its cost of capital, are significantly wider than the 94 banks of the S&P 1500 Bank Index (3.75% vs 3.37%).
• Earnings growth has exceeded the averages, both for the past 3 years and based on 2016 estimates (16% vs 13% and 14% vs 9% respectively). We also note this year’s estimates exceed the broader S&P 500 Index earnings forecasts by 2-3 times.
• Return on Equity figures are comparable to those of non-acquisitive banks, indicating transactions were generally accretive to earnings and therefore positive for shareholders of the buying banks. As Gleason commented at the C1 Bank acquisition announcement, “We strive to be an industry leader in providing best-in-class customer experience and operational efficiencies.”

Operational efficiencies are the operative words here. Streamlining procedures and integrating software gets very expensive, so does added regulatory compliance since 2008. Former American Banker Association President and two-term Oklahoma Governor Frank Keating told me Dodd-Frank costs the average Main Street bank 17 percent of operating profits. So the fact these twelve banks have been able to deliver superior earnings growth and maintain ROE while integrating multiple acquisitions speaks volumes. It also explains why they trade at a slight premium, in terms of price to tangible book value (1.83x vs 1.64x).

These regional banks have found a formula for earnings growth which eludes their larger money-center brethren. It’s a combination of strategic acquisition at the right price, organic expansion in niche markets, and rigorous attention to costs/efficiencies. Their proven ability to generate superior growth without sacrificing return on capital is all the more impressive considering two key facts:

1. Net interest margins for the industry as a whole sit near the lowest level since 1985, reflecting both a challenging environment near-term and a soft outlook into 2017

2. Bank stocks tend to lag NIMs by up to five years, as bond markets adjust faster to perceived future conditions than real world bankers can originate new loans (see below)

Powerful Headwinds

Profit Margins and Time Lags

BuyTheBuyers2 Profit Margins and Time Lags


Again, these banks have outperformed in spite of powerful headwinds. Their NIMs are rising and so are their stocks, which is why investors are paying a higher multiple of book value. As large money center banks continue parking excess reserves at the Federal Reserve to earn 25 bps, these strategic buyers are aggressively deploying capital to increase their footprints. They are building their businesses. They are the one slice of the banking sector to own now.

Smokey the Banker (Issue #1.3)

Smokey the Banker

Nine Stocks with 10% Growth at 10x Cash Flow

  • Central bank balance sheets still 3-6 times pre-2008 levels… and rising
  • Recent actions by BoJ and ECB exacerbate deflation
  • Financial debris piling up creates incendiary conditions
  • Protect capital in proven Growth at Reasonable Price (GARP) strategy

Quail plantations cover south Georgia’s pine barrens for miles. Hours pass as you make your way through sage brush and red clay, steering your horse around pines taller than the sky. It’s an lyrical place and I found myself transported. Strangely though, something our huntsman said about annual shrub burns in March led my mind back to the canyons of Wall Street and rip tides of Washington. Allow me to explain.

Longleaf pine forests overhead and grasslands afoot sustain native quail populations which once stretched from Virginia to Florida, as far east as Texas. They survived for centuries through diversity and resilience. In addition to providing habitat for up to 300 separate plant species and 60 percent of the region’s amphibians and reptiles, their seeds could withstand the heat of regularly occurring forest fires, sometimes only sprouting because of heat. These boom/bust cycles occurred regularly, clearing the forest floor from debris and providing ample opportunity for plants to regenerate… ultimately creating more suitable habitat for quail and other wildlife.

Today this ecosystem covers just three million acres across the southeast, down from an estimated 90 million acres before settlers began arriving 300 years ago (The Smithsonian). In addition, a stated “zero tolerance” policy against forest fires by U.S. Forestry Service mascot Smokey the Bear means forests don’t purge themselves naturally, creating an unnatural build up of dead wood which has contributed to a 19 percent increase in fire season length over the past 35 years (Nature Communications study, July 2015).

As we rode across fields where nature still rules, I was stunned by the now fire-free example presented by global asset markets. Central bankers want no part of cyclical downturns. Fire is something they now seek to avoid at all costs. Their artificial buying has contorted rates into negative territory past the point of recognition. Smokey the Bear meets Janet Yellen. Zero tolerance meet Zero Rates. Again, I digress.

Georgia’s plantation owners are working overtime to rebalance and replace these vast forests, often partnering with local institutions like Auburn’s School of Forestry & Wildlife Sciences and the Tall Pines Conservancy. As my guides explained, the process begins in March and April, when forestry wardens grant permits to conduct controlled burns on private land. Fire eliminates dead wood, consumes oak saplings which starve ground plants of light and produces heat which open spores and seeds. Within weeks, green shoots emerge.

By the second season, a canopy of broom sage hovers four feet above soil no longer scorched by fire, teeming instead with insects. It’s the perfect environment for quail to move in and begin brooding. They are shielded from hawks circling above, while surrounded with ample food for their chicks on the ground. As July arrives the birds will begin exploring corn and sorghum patches farther afield, feeding on an abundance of seed from newly sprouted crops. Come November, they’ll circle fields in coveys of up to 30, relying on one another to fend off predators. Many will survive for several years, though a few will get paired with bacon, as was the case on our particular weekend.

My time in Georgia revealed the modern quail plantation is about restoring as faithfully as possible the natural lifecycle. Full-time staff with forestry degrees serve as caretakers of the land, facilitating blossoms and burns… booms and busts. Their six to ten thousand acre parcels attempt to duplicate what happened for centuries before the advent of roads, homes and businesses. If only the Fed could shift its annual policy conference from the rivers of Jackson Hole to the pine groves of south Georgia…

To the Fed’s credit, it stepped into the abyss of 2009 when banks and private institutions ceased to function. The Fed provided a bid as the lender of last resort and prevented a full-scale meltdown. But as former Dallas Fed President Richard Fisher offered on CNBC mid-January, “We at the Fed brought demand forward by several years by keeping rates so low for so long.” Put another way: We prevented the burn, and now it’s a tinder box.

Like Smokey the Bear, they’ve made clear no fires are allowed… controlled or otherwise. In the words of ECB President Mario Draghi, “Whatever it takes.” He’s not alone. In January, Bank of Japan governor Haruhiko Kuroda lowered the rate paid on excess reserves posted by banks at the BoJ to negative -0.1 percent. Not only is Mr. Kuroda disallowing the removal of debris from the forest floor, he’s imposing a penalty if anyone picks it up.

The logical consequence of increased debris is a much hotter fire, and we may well be stacking the wood past the danger point. Assets held by the four largest central banks outside China (BoE, BoJ, ECB, Fed) have risen fourfold on average since 2000.

Debt Pile

Central Bank Asset Growth


SmokeyTheBanker2 Central Bank Asset Growth

Another recent policy adjustment proves troubling. On January 27, The Federal Reserve released its latest outlook and chose to include some new wording about “monitoring markets.” Smokey, put down the binoculars. The Fed already has a dual mandate, assigned by Congress in the Reform Act of 1977, which states explicitly “the goals of maximum employment, stable prices, and moderate long-term interest rates.” Adding this market-facing mission only increases the Fed’s already interventionist bias. Again, no chance of a natural burn on Chair Yellen’s watch.

One final thought about fires and barking dogs: they wake us up. When a fire erupted inside the walls of my Georgia host’s home months earlier, he was alerted by an otherwise calm labrador retriever. The dog growled at the walls, barked until he was heard and wouldn’t leave until the children were out.

China’s 48 percent implosion since May is our barking dog. For six years we have laid comfortably in our beds as Zero Interest Rate Policy (ZIRP) by the world’s central banks have pushed otherwise responsible investors into inappropriate assets father afield. No longer. The current correction reflects a reassessment of risk by global asset managers. Where the bankers failed to clear the floor of debris, asset managers are now pruning proactively, and they’re not done cutting. The limbs have gotten long, and S&P 500 Index offers little value at 17 times earnings, specially given four consecutive quarterly earnings declines.

As a result we need to find a brush-free clearing for our assets, as well as some blue sky overhead. We turn to our friend David Herro of Harris Associates, named Fund Manager of the Decade by Morningstar in 2010. David is soft-spoken, thoughtful and precise. His stock selection process begins with a timetested screen he runs periodically to identify growing companies with little debt, trading on the cheap:

• Price to cash flow less than 10 times
• Net Debt to cash flow less than 2 times
• Return on Equity (3-yr avg) at least 13.5 percent

89 companies in the S&P 500 Index meet David’s criteria, and as he notes, stock screens are a place to begin, not an end unto themselves.

To narrow the list, we added two more conditions: Projected earnings growth in 2016 of at least 10 percent and positive earnings revisions during the past 60 days. Eight names fall off the list, proving the combination of 10 percent growth at less than 10 times cash flow is difficult to find. As fire risk rises around us, these are the types of places where we intend to seek refuge for a portion of our assets.

SmokeyTheBanker2 Price_Cashflow, NetDebt_Cashflow, ROE, EPS

Matrix Goes Mainstream (Issue #1.2)

Matrix Goes Mainstream

Six Data Mining Companies Watching You

  • Retailers employing same data mining techniques as NSA to drive growth
  • Data Management’s mandate has expanded fromBiz Intelligence to Predictive Analytics
  • Venture Capital investments in Artificial Intelligence setting new records
  • Target’s vast data project provides a window into the future

“You look surprised to see us again Mr. Anderson. That’s the difference between us. I’ve been expecting you.” -Agent Smith, The Matrix

From Matrix to Minority Report, Avatar to Ex Machina, Hollywood keeps churning out conspiracy stories about big data, even as the rest of us voluntarily upload everything from location to likes… and retailers can’t get enough of us.

Take Target for example, where an app-based coupon program called Cartwheel has lit a fire under 25 million shoppers. The more you buy, the more it learns about what you like. The customized deals and discounts just keep coming. Scary? Hardly, more like manna from heaven.

We recently got the inside view on Target’s (TGT) data-driven shopping experience from man who designed it, Chief Marketing Officer Jeff Jones. He refers to customers as guests, and his centralized data collection hub the Center for Guest Excellence. We had the pleasure of interviewing him at J.P. Morgan Masters‘ Series in New York.

“The mobile phone is the most powerful shopping device ever created,” Jones tells a group of over 100 marketing professionals. To illustrate the point, he describes Target’s smartphone app, which directs people around the store to locate products, even maps their most efficient route for an entire shopping list. Out of stock? Not when the app sources it from another store and ships it to your home overnight.

Indoor mapping is made possible through a partnership with a company called Pointe Inside, while Target’s Cartwheel app was developed in-house. Both offer a glimpse into how the mega-retailer uses mega amounts of data to envelope shoppers into what’s become the Holy Grail of retailing: an integrated omni-channel experience (industry jargon for fully integrated, where customers don’t distinguish between digital and physical shopping, and stores double as distribution centers for online orders).

Think of Target’s Center for Guest Excellence as a giant sieve which funnels every conceivable piece of data into one central location for realtime analysis. Purchases, complaints, special requests –even intangibles like mannequins placement– are logged and analyzed to improve a guest’s experience. Ultimately, Target is indifferent between a sale in-store versus a sale online. They key says Jones, is creating a “seamless, excellent experience.”

“The dream is people would come to Target.com, but that’s not where it happens. Social platforms like Facebook are so pervasive… digital is now 51% of our ad spend. People go to Pinterest to figure out how they want their home to look, then they come to Target. It’s why we’re putting Buy buttons in posts.”

Jones previously served as CMO at The Gap (GPS), and soon after joining Target he embedded the retailer’s engineers at Facebook (FB). His goal was to foster collaboration on how to better identify individual preferences, and then direct the right merchandise at the right time to the right person. Data has become so critical to Target’s mission that every managers’ meeting begins with a review of real-time customer activity. In fact, each employee receives a morning email highlighting three critical trends gleaned from guest data the day before. The read-thru rate is over 90 percent.

Jones approach has put Target on the cutting edge of retail, but a new report from Forrester Research estimates between 60 and 73 percent of data available to large enterprises goes unused. It’s why VC funds like Data Collective, Bloomberg Beta, Khosla Ventures and Lux Capital have invested nearly $1B in Artificial Intelligence (AI) startups since 2010, according to data collected by CB Insights.

MatrixGoesMainstream2 Artificial Intelligence Global Quarterly Financing History

Former Apple (AAPL) and Pepsi (PEP) CEO John Scully saw the opportunity early on and founded Zeta Interactive in 2007. So did eBay (EBAY) co-founder, Peter Thiel, whose privately owned Palantir Technologies was most recently valued at $15B. Here’s how the company describes itself on it’s webpage:

We’re focused on creating the world’s best user experience for working with data, one that empowers people to ask and answer complex questions without requiring them to master querying languages, statistical modeling, or the command line. To achieve this, we build platforms for integrating, managing, and securing data on top of which we layer applications for fully interactive human-driven, machine-assisted analysis.

Data analysis on the scale employed by pioneers like Palantir, and customers like Target is a multifaceted task which requires massive storage and supercomputer-like power. In broad terms, the industry can be divided into three primary categories:

• Data Management (DM) gathering, scrubbing and organizing metadata
• Business Intelligence (BI) processing data and gleaning insight
• Predictive Analytics (PA) using data to anticipate future activity

Large amounts of data require significant plumbing… vast holding tanks for storage and interconnected pipes for transport. Adding more data is not as easy calling Cisco and purchasing another server, or even Amazon Web Services and renting more cloud space.

For anyone who remembers plugging data into dBase back in the 90s (my first job out of college at Merrill Lynch), we’ve come along way. Data strings are now so dense and cumbersome they require specific solutions. The primary architecture used to manage metadata is called Hadoop, an open source Javabased framework created by two engineers in 2006, and named for the toy elephant belonging to one of their sons. In case you think calling it Hadoop sounds silly or belies its importance, IDC values the market for Big Data at $122B.

Forrester describes Hadoop as “mandatory” for any enterprise looking to identify actionable strategies based on advanced analytics on large amounts of data. Its three primary components include a distributed file system (HDFS) which distributes large data blocks across commodity machines to maximize bandwidth, a resource management platform (YARN) which minimizes stress on any one CPU or server array and a compression program (MapReduce) to speed up processing.

Forrester ranks privately held Cloudera as the #1 Hadoop pure play in its 1Q 2016 report, followed closely by publicly traded Hortonworks (HDP). Other top rated companies include MapR and Pivotal Software, though like Cloudera they too are private. Many of these companies are less than ten years old, and while they are growing sales 40-50 percent annually, most are not yet profitable.

Early VC investors are effectively banking on data mining as the next core driver of enterprise marketing strategy. As John Sculley told me on BloombergTV. “This is the next big thing. It’s where I’m placing my bet and why I’ve hired 60 software engineers.”

Once enterprises have installed Hadoop across their networks to gather customer data, they can begin to analyze it with a host of products broadly described as Business Intelligence (BI). Author of the AtScale Blog Bruno Aziza, describes BI as the point at which company employees pivot from being “knowledge workers to knowledge seekers.”

Gartner published its annual 2016 Magic Quadrant for BI the first week of February and only three companies of 24 made the coveted leaders’ box: Microsoft (MSFT), Qlik (QLIK), Tableau (DATA). This year marks Gartner’s 10th annual report, and it has become the document of reference for buyers of BI technology. To make the so-called magic quadrant, companies have to demonstrate both completeness of vision and ability to execute.

Tableau pioneered the concept of converting multiple data sets into straight forward charts with a its dragand-drop desktop dashboard (demo at: http://www.tableau.com/products). Tableau’s software enables any information tracked by an enterprise (product sales, web traffic, store visits, etc) to be charted and compared across multiple factors with a few mouse clicks. Programmers call this visualization, and the goal is to empower marketing execs with tools to spot trends in realtime.

As an example, Target’s CMO Jeff Jones mentioned how sales associates reported 2-3 fold sales increases when certain items were featured on mannequins. Some further noted how mannequins placed in specific areas attracted more attention then others, driving additional sales. Data visualization would take all that information and create a map of the sales floor, illustrating optimum mannequin usage and placement. Charting over time might reveal further insights, like different traffic patterns on different days. Mannequins could be shifted after hours to maximize expected patterns for the following day.

Not surprisingly, Tableau’s consistent 90 percent gross margins are among the highest in the entire software sector, but growth has halved to 30 percent as competitors have entered the market.
Specifically, Bloomberg Intelligence BI analyst Mandeep Singh identifies fellow Gartner Magic Quadrant leaders Microsoft Power BI and Qlik Sense. Amazon (AMZN) and Salesforce.com (CRM) have also introduced their own BI solutions, QuickSite and Wave.

Critically, these newer entrants are taking business intelligence a step further, analyzing changes over time in order to generate forecasts about the future. Its called Predictive Analytics (PA) and its the latest evolution of data analysis. Other companies making the jump to more predictive software capabilities include Apigee (APIC), Splunk (SPLK), Alphabet (GOOGL) through a series of acquisitions and Microsoft via its Cortana Analytics acquisition.

According to Bloomberg Senior Software Analyst Anurag Rana:

“The ability of cloud application vendors to provide advanced analytics on their core products may become the single biggest distinguishing factor in the year ahead. Machine learning and other advanced data analysis methodologies are becoming increasingly important for clients to better understand their user-base. Rising use of Internet of Things (IoT) products will also fuel demand for analytics. Pure-play visualization vendors will likely expand their product portfolio as competition increases.”

Industrial manufacturers like GE have already joined retailers like Target in making a big push into predictive technologies. It’s part of the $517B IoT market, where machines loaded with sensors push data to a central hub and adapt to changes without human intervention. GE intends to triple revenue at its PA software subsidiary Predix to $15B by 2020. Per Mr. Rana’s calculation, that would make GE a global top 10 software company, competing directly with IBM and SAP.

Bottom Line: Access to data means every major enterprise looking to grow sales must become a software company. No wonder summer camps teach code.

MatrixGoesMainstream2 Data, Gross Margins, Sales

High Yield Now (Issue #1.1)

High Yield Now

Four Bond Funds Too Cheap to Ignore

  • Implied default rates suggest 20% of energy/metals/mining companies will file Ch. 11
  • Excessive pessimism has widened HY spreads to 800bps, exceeding recessionary norms
  • Strong U.S. payrolls growth consistent with expansion not recession
  • HY offers compelling deep value opportunity

Dr. Ethan Harris of Bank America Merrill Lynch is my kind of economist… pedigreed, top-ranked and totally normal. He once confessed to me in a commercial break at BloombergTV he found my co-anchor’s “multi-syllable words way too confusing.” Last month he told CNBC viewers worried about China to “take a deep breath and relax… they only buy 1 percent of our GDP… stuff over there doesn’t exactly say Made in America.”

Dr. Harris manages the global economic research team at BofAML, and since Institutional Investor has ranked him #1 multiple times, we pay particular attention when he changes his view. Recently, Ethan has raised his estimate for the probability of recession in the U.S. over the next 12 months to 20 percent, so did Ellen Zentner of Morgan Stanley.

While less alarming than the 40 percent probability cited the following day by Deutsche Bank economist Joe Lavaorgna, R-word anxiety has compressed the spread between 2-yr and 10-yr government bonds to the lowest in eight years. Long-term growth expectations have fallen so significantly, traders only demand an extra 113 basis points of return for 2026 compared to 2018. That’s the kind of malaise we witnessed in 2008! Sorry Ethan, but no wonder economics is dubbed the dismal science.

Bond Bummer

2-10 Spread U.S. Treasuries


HighYieldNow2 2-10 Spread U.S. Treasuries

Admittedly, we’ve seen The International Monetary Fund and World Bank lower growth forecasts repeatedly over the past twelve months, though their pronouncements are hardly recessionary. Each institution still sees global growth climbing 2.9 to 3.1 percent, with the U.S. likely averaging just above 2 percent. In fact, not one of the 71 strategists tracked by Bloomberg forecasts negative GDP in the next two quarters, traditionally the definition of a recession.

So by going against the grain, Messrs Harris and Lavorgna are either dead wrong, providing cover for themselves in case we do enter recession, or possibly they are just early.

For clarity we turn to the labor market, which typically peaks 18-24 months ahead of recessionary downturns. We’ve charted the year-over-year change for monthly non-farm payrolls to illustrate the point. Recessions are identified by shaded areas. Severe labor downturns preceded all three recessions, which is not the case currently. January non-farm payrolls rose 1.90 percent, consistent with the 6-month average of 1.97 percent. If recession were in the offing later this year, we’d likely already have seen a steep decline in job growth.

No Downturn…No Recession

Non-Farm Payrolls Still Rising 2%


HighYieldNow2 Non-Farm Payrolls Still Rising 2%

The National Federation of Independent Businesses provides additional comfort about continued labor market strength. It’s monthly survey of 1,400 geographically diverse firms across multiple industries indicates 29 percent of respondents have positions they are unable to fill, a six-month high. Additionally, 11 percent plan to hire additional workers within the next year, consistent with the 6-month moving average of 12%. If business owners are optimistic about hiring, in spite of having to pay 2.5 percent more in hourly wages per the January Jobs Report, we think investors should be more optimistic about the economy. Instead they are running scared.

This fear is most evident in the high yield market, where falling energy prices have gutted the energy sector and widened spreads across the board as if wholesale recession were a foregone conclusion.

Since the best outcome bond investors can expect is repayment in full and coupons along the way, they are notorious for fleeing a fire before there’s smoke. Strategas Research Head of U.S. Fixed Income Tom Tzitzouris explains:

“Defaults are rising and spreads should rise too, but the pace in Jan was a bit too fast for the rate of economic and credit decay. Above 700 basis points, high yield spreads signal a recession. Above 750 they are starting looking cheap. Current spreads at 777 imply a 6.25% default rate… high for a non-recession calendar year and almost 2% above longterm averages.”

Translation: The high yield debt market is oversold and should be bought.

And here’s the key…

Weakness in energy is skewing the entire high yield market. Energy accounts for just 16 percent of high yield issuance but could potentially account for 53 percent of total defaults this year, provided JPMorgan is accurate and one in five energy companies files Chapter 11. Add the related metals/mining sector and the number rises to 71% (J.P. Morgan Debt Monitor).

Never before have one-fifth of America’s energy, metals, and mining companies defaulted in the same year. JPM recently initiated this forecast to present a worst case scenario. In fact, it’s the only way to arrive at an overall HY default rate of 6 percent, since all other sectors will likely see the same sub-2 percent rate of the past several years.

To Tom’s point, spreads above 750 bps imply defaults above 6 percent, and 6 percent is only achievable if energy, metals and mining implode at rates never before witnessed. At these prices, buyers are being well compensated for the risk. We like high yield here.

So THANK YOU nervous bond investors for throwing away your perfectly good bonds. Your fear presents a value opportunity, and while we could certainly buy individual issues, we will opt instead for the diversification of exchange traded funds (ETFs) which invest in a basket of bonds from HY issuers.

Bloomberg lists 33 high yield ETFs, including the two largest and most liquid: iShares HY Corporate Bond ETF (HYG) and SPDR Barclays NY Bond ETF (JNK). We will not consider these two however, as their energy exposure 9.5 and 10.9 percent respectively. Instead we focus on several others with lower exposure. They are all diversified, provide reasonable yield and meet minimum liquidity requirements. In addition they are down on average only 1-2 percent this year, implying reasonable safety compared to stocks.

HighYieldNow2 Yield Energy Cost table