
Elephants, Donkeys & Dogs
5 Reasons to Buy Puts Now
- 19 mini sell-offs in 5 years have generated average declines of 7.45%
- September is historically the weakest month for stocks since 1929
- Highly defensive sectors are outperforming the broad market four to one
- The Volatility Index (VIX) near historic lows means puts options are relatively cheap
Cable news networks have never had it so good. Viewership is through the roof as politics go 24/7 and AC provides refuge from the heat. America has become so enthralled with the election that nothing else seems to matter. Olympics in Rio? I’m still waiting for the buzz. What about Naval Action in the South China Sea, or a Breakthrough in Syria… Nope. Stocks at all-time highs? Hello? In these Dog Days of
Summer I hear nothing but crickets. Donkeys and elephants have stolen the show. I think we’d be wise to distance ourselves from this heard and recognize risk is seldom so singularly focused. Time to buy insurance and protect our capital.
I want to present several charts and graphs to illustrate why I am a buyer of S&P 500 puts. I think they help tell the story more poignantly than words alone. While I recognize the world’s central bankers effectively have our back and will immortally do “whatever it takes” per ECB President Mario Draghi, too many indicators are gnawing away at me, starting with this one:
1. Sell-offs Happen… Frequently
S&P 500 Index
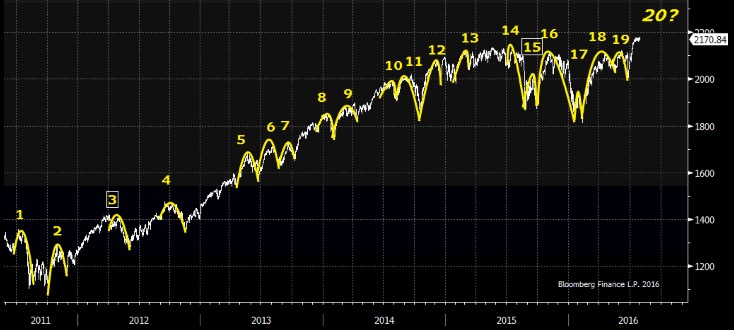
The S&P 500 Index has experienced 19 sharp declines of 7.45% during the past 5 years, with half of them happening in the past 2 years and generating some particular nasty downdrafts. As you can see on the far right side of the chart, the index is now perched at all-time highs as if poised to produce another “golden arch” –fries not included. I fully recognize the market bounced back each of those 19 times, but I also recognize the index trades at an historically rich 18.4x earnings (assuming $118) and FactSet now forecasts a sixth consecutive quarterly earnings decline come 3Q reporting season. Ask yourself why you are buying all-time highs absent earnings growth. If it’s because the Fed has your back, and you have no place else to go, by definition this picture should make you uncomfortable. You need insurance in the form of puts.
2. Approaching Seasonal Weakness
Monthly Returns Since 1929
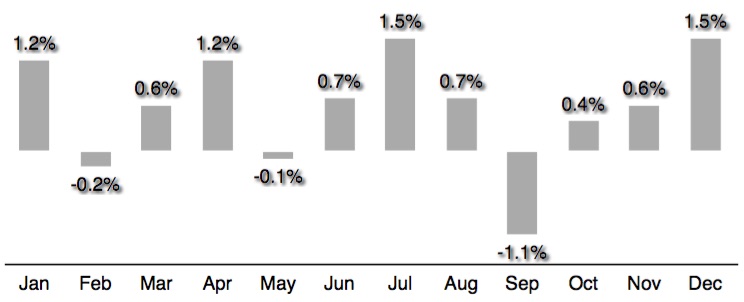
Jeff Hirsch and his team at the Stock Traders Almanac have done some excellent work on seasonal tendencies across markets over long periods of time. Among their best known and oft cited observations, the S&P 500 Index typically posts its worst month in September. It has declined an average of 1.1% during September since 1929 and it’s one of only three negative months of the year. This would not be reason enough to buy puts, but in light of valuation and the apparent stalling out at new highs from our previous chart, it’s another reason to play it safe. We are entering the seasonally weakest month of the year, meaning the odds are less in our favor. As we try to smooth out returns and differentiate ourselves from the indexers, we need to be aware of the potential for downdrafts and protect against them. Speaking of safety, look what’s leading performance this year…
3. Awkward Leadership (aka The Last Shall Be First)
Returns YTD

There is only one reason why slow-growing Telecom and Utilities are outperforming the broader index this year by 4 to 1: Dividend Income. They yield 4.4% and 3.1% respectively, which significantly exceeds the 1.9% average for the broader market. Income is a fine reason to own stocks in an anemic low growth environment where the 10yr Treasury yields about 1.5%. However, safety is not indicative of a bull market. Boring consumer staples are so over-owned right now they trade at 23x earnings and yield just 2.5%. In addition, only 60% of the 500 stocks in the index are above their 20-day moving averages, compared to 95% three weeks ago. This tells me fewer stocks are holding us up. When breadth declines and defensive groups are leading, I get uncomfortable about a downdraft.
4. No Trend Whatsoever
Real Clear Politics Polling Average
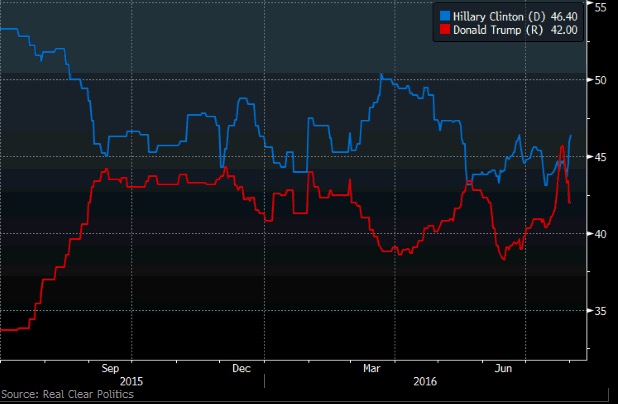
The inability of either candidate to breakout from a plus/minus 5% margin of over any period longer than several weeks is highly challenging for anyone trying to deploy longterm capital. There is simply no discernible trend. While we can argue Clinton is good for hospitals through increased government backed funding, Trump would presumably be the opposite. Similarly contrasting outcomes can be made for coal, drilling, multinational tax policy and even defense (On this last point, Trump’s America first orientation might make him LESS tolerant of overseas defense spending than Clinton… how’s that for a mind-bender). My point is markets ABHOR uncertainty and the dynamics of this election are more uncertain than any in recent memory. With still nearly 100 days to go, I suspect there will be enough nervous energy to create more than one unpleasant sell-off in coming weeks.
5. The Crocodile (see the teeth?)
S&P 500 Index vs the Volatility Index
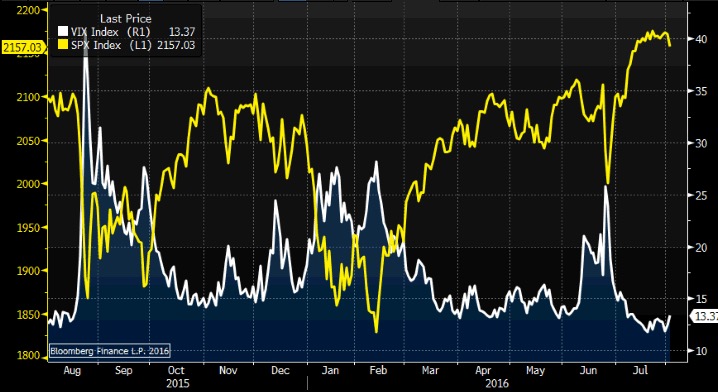
My thanks to Minyanville Founder Todd Harrison for sharing with all of us his favorite chart depicting “animal spirits.” He calls it the Crocodile chart because of the ominous gaping jaws at the far right. The SPX at all-time highs and the VIX near all-time lows create the image of a croc with its mouth wide open and ready to pounce. Admittedly not very scientific but a great image nonetheless. It reminds us stocks are expensive the volatility is cheap, which brings us to my actionable point.
–> Time to Buy Puts
I like trading options on the SPY, which is simply the S&P 500 Index with the decimal moved over one place to make transactions more affordable. So SPX at 2180 equates to SPY at 218.00. Additionally, I generally buy puts 2 months into the future which are slightly out-of-the money and will accelerate quickly in the event of a decline.
As an example, the September 30th puts struck at 215 cost 2.90 per contract. This is a total dollar outlay of $290 per $21,500 of notional exposure, which equals about 1.3% for 55 days or about 8.5% on an annualized basis.
Think about it. You can carry exposure into a risky time of year with unknowable election volatility and high valuation, or you can spend a small amount of money for peace of mind. For me the choice is clear. Buy puts.
Now go enjoy your August vacation.
Subscribe at https://bullseyebrief.com