
Chasing Alpha
Six Factors Matter Most Now
- Many of the 50 largest U.S. stocks trade significantly below all-time highs
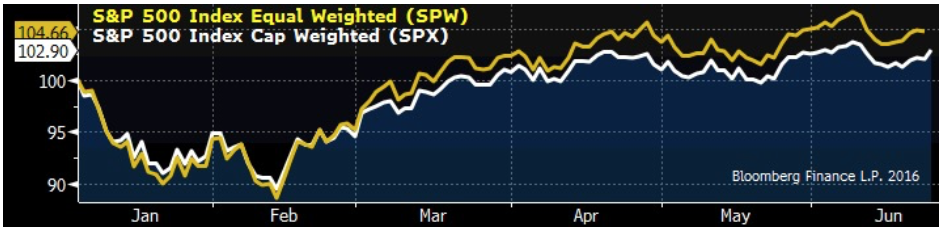
- Leadership is pivoting as equal weight indicies outperform cap-weighted indicies
- Growth oriented companies dominating traditional value plays
- Return attribution analysis points to late-cycle themes as drivers of outperformance
America’s biggest companies aren’t pulling their weight. The ten largest components of the S&P 500 Index are down an average of 16.5% compared to their all-time highs… and it’s not just Apple. Google (ok Alphabet) is off about 12% since printing a top back in December. General Electric promises to “Bring Good Things to Life” but its stock still sits 49% below the high 16 years ago. Similar story AT&T. These stocks have been real dullards for a long time, in spite of ranking as some of the largest and most widely help companies in the world. Hmmm, at least they pay dividends.
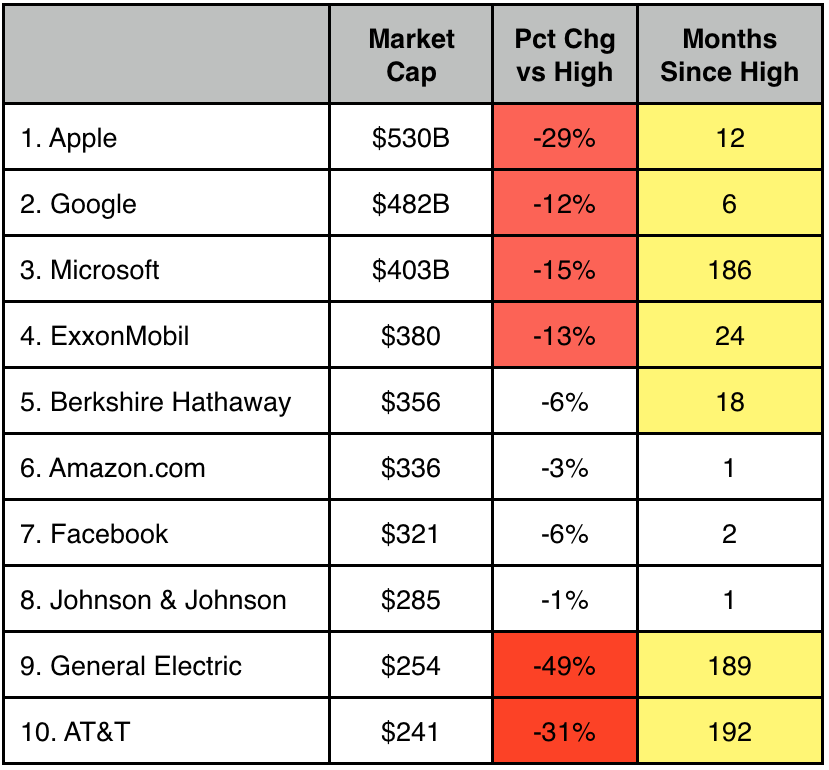 Amazon and Facebook have managed to buck the trend, but leadership among the “leaders” has been hard to come by. I show the ten biggest S&P 500 stocks by market cap to illustrate the point. Again, this group is down an average of 16.5% from individual all-time highs, and those highs were recorded an average of 64 months ago. Patience is a virtue. Or torture. Look at Microsoft. It peaked 186 months ago, but still sits 15% below the peak. It may be the third largest company in the U.S. but it hasn’t exactly produced
capital gains for its legions of investors. Then again I shouldn’t be too hard on Mr. Softy. Broadening the sample to include the largest 25 or even 50 components only underscores the point. Current marks are off 16% and 19% respectively, compared to all-time highs. Big stocks are a big disappointment.
You can see how weak performance by the largest stocks has taken its toll on the S&P 500 Index, which is weighted by market capitalization. It lags the equal weighted version of the index by 176 basis points.
Falling Behind
My friend Chris Verrone of Strategas Research Partners keeps a running tally of how many trading days have elapsed since the S&P 500 Index last made a new high. As of Friday June 24, the count is 275, which he says is the third longest period on record since WWII. To find longer period of consolidation — which I’ll describe as sideways action marked by a lot of impatient portfolio managers lamenting “nothing works” –you’d have to go all the way back to 1983/5 (323 days) and 1959/61 (374 days). The fourth comparable period occurred 1994/5 and lasted 259 days. So this current period of malaise has just moved into the third spot. Critically, Chris notes that markets erupted higher when they did eventually break out, rising 11-36% over the following 12 months. Hope springs eternal.
New Leadership
The inability of mega-caps to lead this market higher, and their erosion in performance relative to smaller companies speaks to a change in leadership. The operative question is: So who’s leading now… and what do we buy?
The one word answer is Energy, which accounts for 8 of the 10 top performing companies in the S&P 500 this year. The group is bouncing from extremely depressed valuations as noted in my “Friends in Low Places” write-up from late May. If you bought those names a few weeks ago, you’re up 5-10%. Stay long.
Looking beyond sector selection, we can figure out which factors matter most right now by slicing the data with the help of a Bloomberg terminal. As an example, let’s say we want to quantify the impact of superior earnings growth on stock performance. Sounds obvious right? Here’s how we actually prove it numerically:
• Rank the S&P 500 constituents by earnings growth and segregate the highest 10% (top decile)
• Compare the performance YTD of this subset to the broader market
• If stocks with the highest earnings growth are outperforming, clearly it’s a relevant to stock selection
• Repeat the process for other key metrics (Low P/E, Sales Growth, etc)
• Compare performance by factor to determine which ones matter most this year
What’s Driving Returns in 2016
Performance YTD by Factor (Top Decile)
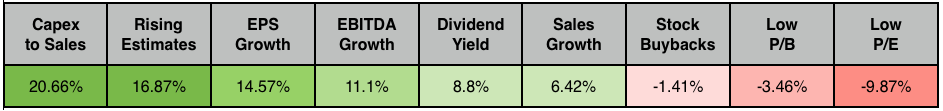
We can see the fifty companies in the S&P 500 Index with the highest ratio of Capital Expenditures to Sales (top decile) are up 20.66% this year. In other words, the market is rewarding companies which invest in their business at a higher rate than their peers. The market is sending us a clear message to prioritize higher rates of capex as we make our stock selection. The second most important factor is rising earnings estimates, which is somewhat more intuitive than increased capex I admit. So is actual earnings growth, the third most important factor. Curiously, value is underperforming this year. Stocks with low ratios of price to earnings and price to book are actually down this year.
The real point of this exercise is to better understand where we are in the economic cycle. In 2010, stocks were cheap and the market rewarded PMs for buying undervalued companies. Today growth is harder to find, and the market is placing a premium on those companies which are growing faster. It’s also rewarding companies for investing in their businesses, on the assumption this will drive earnings growth in the future. This is much more of a late cycle orientation and it coincides with several years of economic expansion, even if said growth is somewhat slower than we all might like #JanetYellen.
What to Buy Now
We can apply the top four ranked factors to the S&P 500 Index as a screen in order to position our portfolios for growth in the second half, especially if we get the kind of lift-off implied by Mr. Verrone’s work analyzing breakouts.
Incorporating the conclusions of my factor analysis, I screened for companies with above average capex as a percentage of sales, rising consensus estimates, minimum 5% earnings growth, and dividend yields of at least 2.5%. 18 companies met my criteria, and collectively they are up nearly 15% YTD, about 5 times the return of the S&P 500. These stocks are clearly in the “sweet spot” of what the market is rewarding most right now.
AvalonBay Communities, Inc. (AVB), Centerpoint Energy Inc (CNP), CMS Energy Corp. (CMS), Essex Property Trust, Inc. (ESS), Extra Space Storage (ESR), General Motors Corp. (GM), Iron Mountain Incorporated (IRM), L Brands, Inc. (L), The Macerich Company (MAC), McDonalds Corp (MCD), Nextera Energy (NEE), Oneok Inc. (OKE), PG&E Corp (PCG), Public Storage (PSA), Teco Energy (TE), WEC Energy Group (WEC), Xcel Energy Inc. (XEL), YUM! Brands Inc. (YUM).
Note: If you read my note on real estate “over development” you know I am negative on hotels. In addition, two weeks ago I also expressed caution on homebuilders, though I like home furnishing companies MAS and MHK. This screen produced several REITs, which I admit causes me some agita especially AVB and MAC. I’m less concerned with the storage companies (ESS, EXR and PSA). I left all five in the report to honor my methodology, but would not necessarily buy them.