
Government’s Greatest Gift
How to Double The S&P 500
-
Dividend reinvestment in pre-tax accounts generates significant outperformance over time
-
Only 54% of U.S. working adults participate in retirement benefit plans
-
Second quintile dividend stocks offer the best risk-adjusted returns
-
Q4 rebalancing yields SIX NEW DIVIDEND STOCKS
American illustrator J.M. Flagg created his iconic image of Uncle Sam for Army recruiting posters in 1917. He borrowed the nickname from the troops themselves. They’d affectionately dubbed an Army meat supplier Uncle Sam for stamping the letters “US” on steaks headed to the front during the War of 1812. Flagg loved the story and decided it fit his image of what government ought to represent. Our perception of government may have shifted somewhat, and arguably pork has replaced steak as Washington’s meal of choice, but there’s still one feast every American deserves: Tax-deferred compounding and 100% dividend reinvestment in a 401(k) account.
Congress first introduced language on tax deferred savings plans into the U.S. tax code in 1978. Today, more than 88 million Americans participate in at least one of 638,390 registered defined contribution retirement plans according to the American Benefits Council. The number may sound impressive, but there’s a problem here. Only 54% of working Americans engage in pretax retirement planning based on data from the Bureau of Labor Statistics. This is absolutely crazy. Pre-tax investing is the single greatest mass market opportunity for individuals to build wealth and retire in time to enjoy the fruits of their labor.
401(k) Ground Rules for 2016
- Pre-tax investing equates an interest-free loan from the government, since every dollar up to a maximum contribution of $18,000 accrues without paying tax until the time of withdrawal
- Many employers match contributions, and the government allows a combined total of $53,000 per year
- Returns earned on investments held in a 401(k) account can be reinvested on a tax-deferred basis. This includes interest, dividends and stocks sold at a capital gain.
This last point is the real kicker, especially when you consider reinvesting dividends without paying tax. You put the money in tax-free, it generates income tax-free, and you reinvest it tax-free. It’s a triple whammy, and it repeats every year. You are compounding your money on the government’s dime. 401(k) accounts represent the single most advantageous retirement plan available and we should all be participating. THANK YOU Uncle Sam.
To better illustrate the point, consider returns on the S&P 500 Index relative to its Total Return Index, where dividends are reinvested pre-tax and commissions are zero. Every time a company in the index pays a dividend, the amount automatically goes towards purchasing additional shares.
Thank You Uncle!
Pre-Tax Dividend Reinvestment
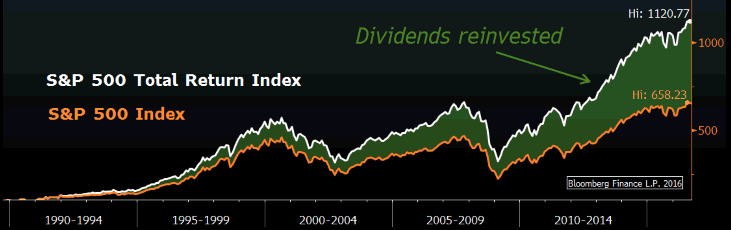
The difference is staggering when seen on the chart above. The Total Return Index produced nearly double the return over the same period (1,120% compared to 658%). The reason is simple: Dividends were reinvested pre-tax and then compounded pre-tax for 25 years. Again, it’s as though the Government is giving you an interest-free loan, enabling you to reinvest dividend income without paying tax. Yes, you will eventually have to pay taxes on the proceeds when you withdraw funds in retirement, but you will have earned income on the Government’s dime for decades. This is a very good deal.
$2.06 Million in 25 Years
Let’s put some real world numbers on this to further prove the point. We’ll be especially conservative in our calculations. We’ll assume the company does not match employee contributions, and the IRS maintains its current maximum of $18,000 per year rather than adjusting upwards for cost of living. Plugging in actual average annual returns from 1990 to 2015 of 8.5% for the S&P 500 Index and 11.4% for the Total Return Index (Bloomberg data), the outperformance of dividend reinvestment in a 401(k) exceeds a million dollars.
Power of Pre-Tax Compounding
S&P 500 Index Returns (1990-2015)
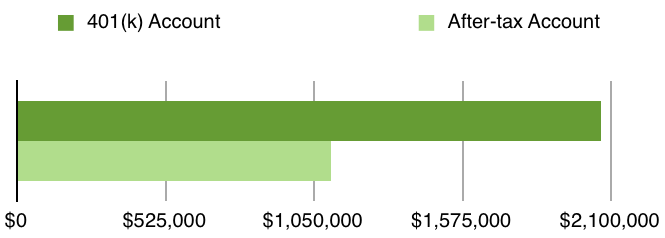
The same S&P 500 stocks in a 401(k) account produced nearly double the return of a standard index fund. In this real-world example, $18,000 contributed annually became nearly $2.1 million over 25 years. This is the power of pre-tax investing coupled with compounding over time. For all the talk (and effort) of finding the next great growth company in Silicon Valley, buying consistent dividend-paying companies and reinvesting the proceeds on a tax-deferred basis works exceptionally well.
Most 401(k) plans offer employees multiple investment funds from which to choose and indexing to the S&P 500 will likely one of them, possibly even the default option. However, choosing an index fund does not guarantee dividends will be automatically reinvested. You have to read the terms of each fund carefully and then either chose a fund which specifically reinvests dividends, or elect dividend reinvestment through the Administrator.
Attention Stock Pickers
For the vast majority of people, selecting an index fund which reinvests dividends is good enough… especially when $18,000 invested annually into a broad index fund can produce a $2.1 million nest egg in 25 years.
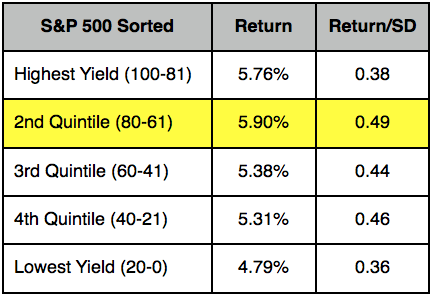
I also recognize some of us appreciate the benefits of stock selection. The investment team at Strategas Research Partners L.P. looked at the risk-adjusted returns of S&P 500 component stocks sorted by dividend yield. (This is simply return divided by the volatility of returns over time, measured by standard deviation). Their research showed the risk/reward tradeoff is maximized when investors buy the second decile of highest yielding stocks (i.e. stocks ranked 61-80% in terms of yield) and rebalance every 6 months.
As their data illustrates, the second quintile produced the highest returns on both an absolute and risk-adjusted basis. In other words, you don’t want the highest yielding stocks, you want the highest yielding stocks adjusted for risk. Second quintile stocks optimize this trade-off AND produce the highest returns over time.
To confirm their results myself, I back-tested the strategy with Bloomberg Analytics on the Dow Jones Industrial Average (DJIA) between 2000 and 2015. The second quintile group outperformed the overall DJIA by a margin of three to one, returning a cumulative 151% compared to 52%. The point is, if you participate in a self-directed 401(k), you have greater leeway to select stocks in your portfolio. Uncle Sam presents one gift, and data presents another. Combine them, and you’re building wealth.
DJIA Second Quintile Dividend Winners
As of September 30, 2016
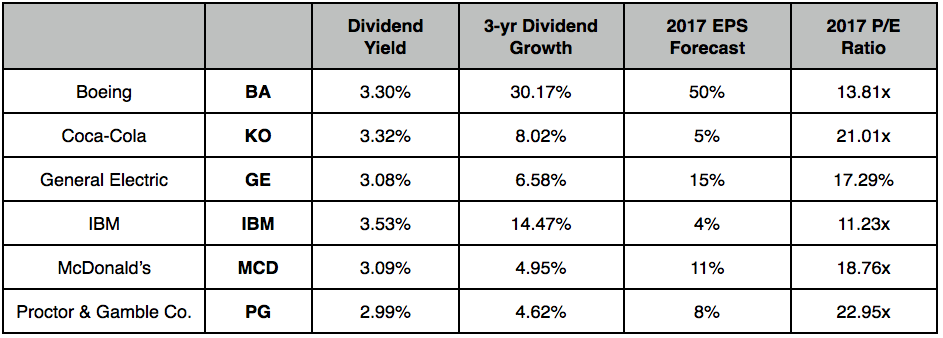
Investors looking to incorporate the second quintile dividend strategy can follow this simple methodology:
- Buy the second quintile dividend components of the DJIA as of 09/30.
- Rebalance on 03/31, and every 6 months thereafter.
- Buy new shares of stock with proceeds from dividend distributions.
- Recognize the backtest revealed 51% turnover annually, meaning three stocks were bought and sold on average every 6 months.
Clearly, EVERYONE should have a 401(k) plan and begin saving as early as possible. In addition, everyone should maximize the full benefits of pre-tax investing by reinvesting dividends earned in a 401(k) plan AND utilizing company matching programs where possible. Finally, hands-on investors may be able to produce additional returns by utilizing the proven dividend selection strategy outlined above.
At the very least, educate yourself on the full spectrum of 401(k) benefits and options by speaking with your financial advisor and visiting IRS.gov. ![]()


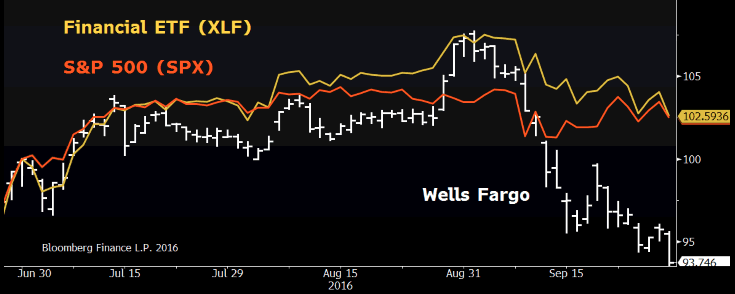
 Wells Fargo currently pays a $0.38 quarterly dividend and yields 3.4%. There is no danger of a dividend cut. The bank has more than enough capital to withstand any added restrictions or additional fees/penalties. Morgan Stanley and others have written publicly they believe regulators will not impose further charges. In an effort to move forward, the bank has already taken corrective measures of its own, firing 5,200 employees and announcing upper management will forgo bonuses this year. Additionally, all affected customers have been credited the full $25 cost they incurred. ATMs offer an apology on the home screen to all users. In an ugly situation, Wells Fargo is doing the right things.
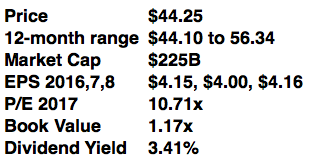 ells for a year. When stocks stop falling on bad news, sentiment has turned and buyers are committing capital. This is the clear sign of a bottomming process and Wells Fargo will not stay cheap for long.
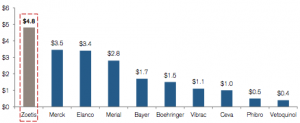 Zoetis Inc. (ZTS) dominates the animal health business, with $4.8B in revenue and a global market share of 23%. It’s also one of the few animal pure-plays among top producers of medicines and vaccines, having been spun-off from Pfizer in 2012. Bankers priced the transaction to reflect a market cap of $2.2B. Today enterprise value tops $28.9B. I can think of few other companies which have increased their footprint fifteen-fold in the past four years.
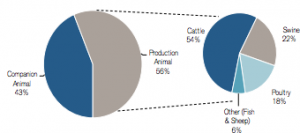
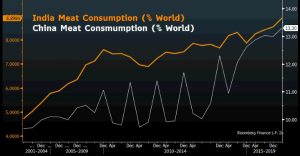 As Americans reach deep into their pockets to protect pets, consumers in China and India are reaching even deeper into theirs… for food. An emerging middle class can now afford protein. Meat consumption in both countries has risen dramatically over the past fifteen years –in India it has doubled. China and India account for 36% of the world’s population (9x the U.S.) but just 22% of the world’s meat, beef and veal consumption (USDA data). Expect increased protein demand from emerging markets, and increased sales for Zoetis.
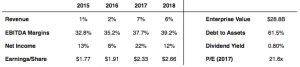
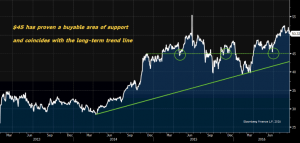
 The Sabine Pass, LA export terminal opened the first of 6 planned “trains” this summer. Each train is a self-contained facility spread over several acres which ingests natural gas via pipeline, super-cools it into liquid form, and then pipes it to holding tanks for export onto ships. Sabine Pass will be at full capacity by 2019, and 5 additional trains are currently planned for a second export terminal at Corpus Christie, TX.
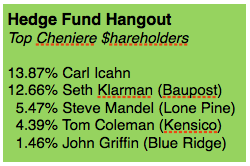 e cargoes in the past 14 months (Jordan, Egypt, Pakistan and Poland). As a result, earnings accelerate from -$1.68 this year to a forecast of $0.76 next year and $2.43 in 2017 –which implies a forward P/E of 18.4x.
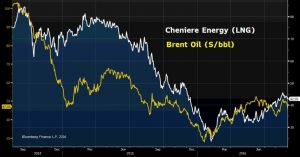 elated barrels of oil equivalent (BOE). As Brent rises, Cheniere and its hedge fund shareholders make more money, especially on the 15% of capacity left unhedged and therefore able to rise with market prices.
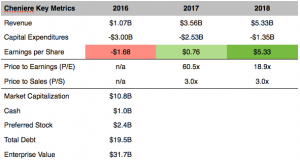
 they have been so reviled for so long. Morgan Stanley’s analyst team sums it up this way: While the group has been a “bellyflop” to own for the first half of year, Financials may pose the best opportunity in the second half of 2016. The bull case is predicated on low ownership, a fundamental expectation of improving revenue comps and still aggressive focus on expenses. Also, banks and asset managers which missed revenue estimates during the quarter actually had positive returns one week later, outperforming stocks in other sectors that missed revenue expectations. That itself is a hallmark sign of bottoming. Morgan Stanly overweight names include JP Morgan (JPM) and Bank of America (BAC). My own top picks are BofI Holding, Inc. (BOFI) and Bank of the Ozarks (OZRK). For more click
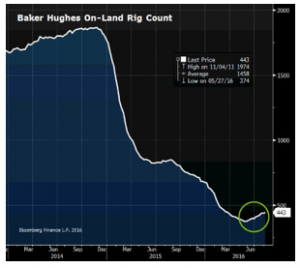 t Louis Dreyfus Energy and because oil so integral to the global economy. The essential thesis behind owning energy NOW is that so much production has been taken offline we are not finding replacement barrels to satisfy future demand –the Baker Hughes Index of active
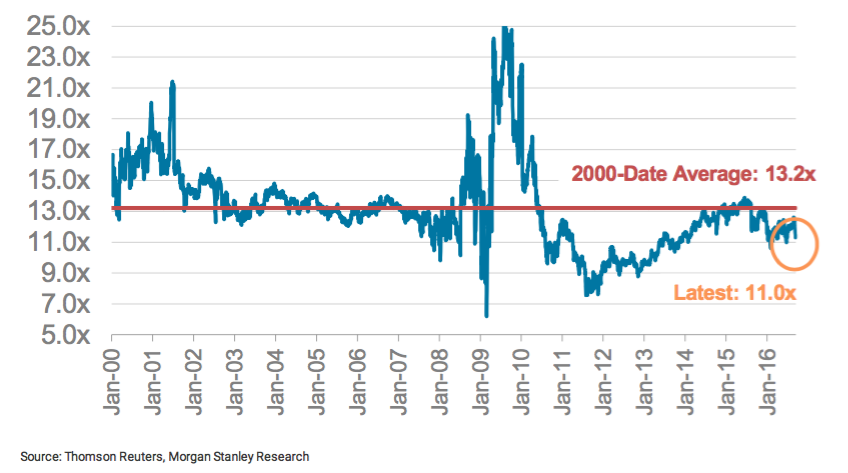
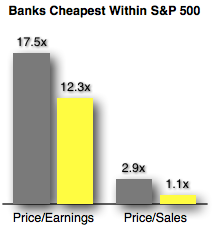
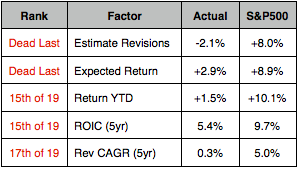 Banks have been dead money for so long. With home ownership still at a 40-year low of 63%, their largest engine of growth has been sputtering. Bloomberg divides the S&P 500 into 19 super-sectors and banks have ranked dead last this year both for earnings revisions and upside potential relative to current target prices. This is because there has been little reason to get excited over the past five years. Bank revenue growth and return on invested capital since 2011 have ranked 17 and 15 respectively. Not surprisingly stock returns too, have been down –though that has begun to change. Banks appear to have finally come home from their exile in Siberia.
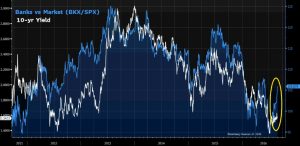
 While the group has been a “bellyflop” to own for the first half of year, Financials may pose the best opportunity in the second half of 2016. The bull case is predicated on low ownership, a fundamental expectation of improving revenue comps and still aggressive focus on expenses. Also, banks and asset managers which missed revenue estimates during the quarter actually had positive returns one week later, outperforming stocks in other sectors that missed revenue expectations. That itself is a hallmark sign of bottoming. Morgan Stanly overweight names include JP Morgan (JPM) and Bank of America (BAC).
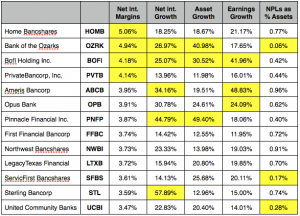
 d. Traders price spreads between 3-4 times the benchmark risk-free rate of return, which equates to an annualized rate of 4-6% with the 10-yr Treasury at 1.5%. So for the professional investment manger eager to earn a return on cash, risk arbitrage presents an alternative to holding short-term assets like commercial paper, certificates of deposit, 6-month T-bills and near-dated corporate bonds. It doesn’t pay the 6-8% returns available on junk bonds, then again it sure beats the negative rates in Europe and Japan. For global asset managers in search of yield, solid M&A transactions with a high probability of closing present a legitimate solution. In addition, healthy M&A volumes present multiple choices.