
Slippery When Wet
3 Energy ETFs for Rational Investors
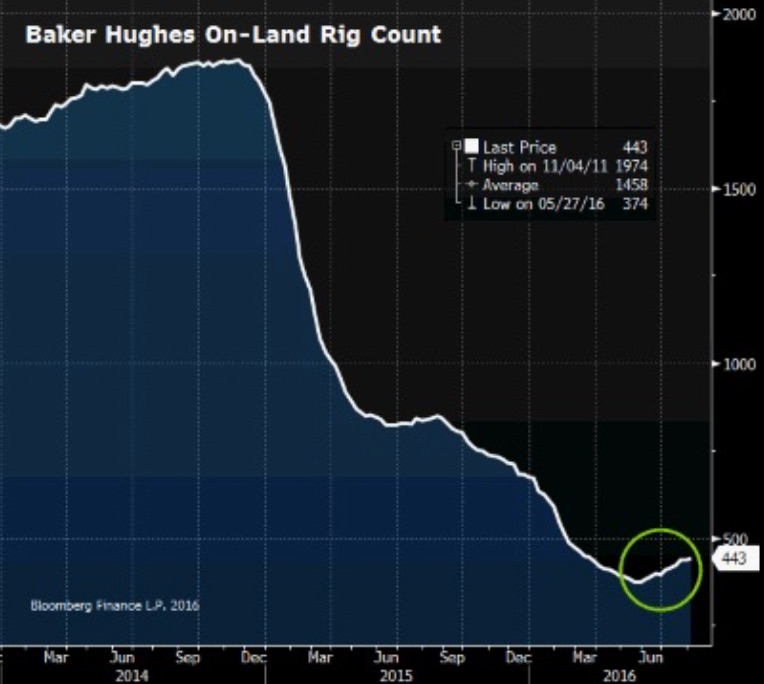
- Baker Hughes Index of active U.S. land-based drilling rigs rises 10% in 10 weeks
- IEA ups its forecast of global refinery throughput to all-time high on strong refining margins
- Mideast OPEC producers still engaging in price war over market share for term contracts
- Energy equities up significantly since Feb lows but flat since May
Misinformation is everywhere, and it’s especially entertaining in the oil business when OPEC ministers chirp about pumping rates. Saudi Arabia’s oil boss Khalid al-Falih promises a ministerial meeting in Algeria next month to stabilize the market, even as he directed Saudi Aramco to pump a record 10.67M barrels in July at the request of customers. He’s quite the chess player, jawboning markets higher while opening the spigots and claiming it’s all about the customer. Does the world really need more oil, Mr. al-Falih? Chinese demand fell to a two year low in July, and U.S. demand has been sideways since May. Oh never mind. Your Kingdom faces a 15% budget deficit and you’re Mr. Fix It.
Maybe I’m being too harsh on Mr. al-Falih. He’s got a hard job. Sunni Saudi Arabia is effectively waging a price war with Shiite Iran to capture share, even as it desperately needs revenue for capital investment and economic diversification. Mr. al-Falih is caught in the middle, and so are the rest of us. On the one hand, OPEC’s need for cash, coupled with U.S. producers’ ability to frack new fields creates an unprecedented supply overhang. On the other, drilling shut-ins and regulatory resistance to build any new refineries in the U.S. since 1977 keeps retail product prices robust. Bull or Bear, depends who you talk to.
Say What
The Absurdity of Labels
Amid all this noise, from pundits arguing on CNBC to record energy bankruptcies in Houston, something amazing appears to happening in the oil business: people are going back to work. The number of rigs actively drilling new wells in the U.S. has risen each of the past ten weeks and now stands at 447 according to the Baker Hughes Rig Count Index. While still 75% below the level seen in 2014 when oil cost over $100/bbl, it’s the strongest indication yet the worst may be over for the drillers.
The rebound in drilling coincides with the International Energy Agency increasing its own forecast for crude demand, arguing strong refining margins incentivize higher operating rates. The IEA now says refinery throughput will rise by 600kb/d to a record 80.6Mb/d in the second half of 2016.
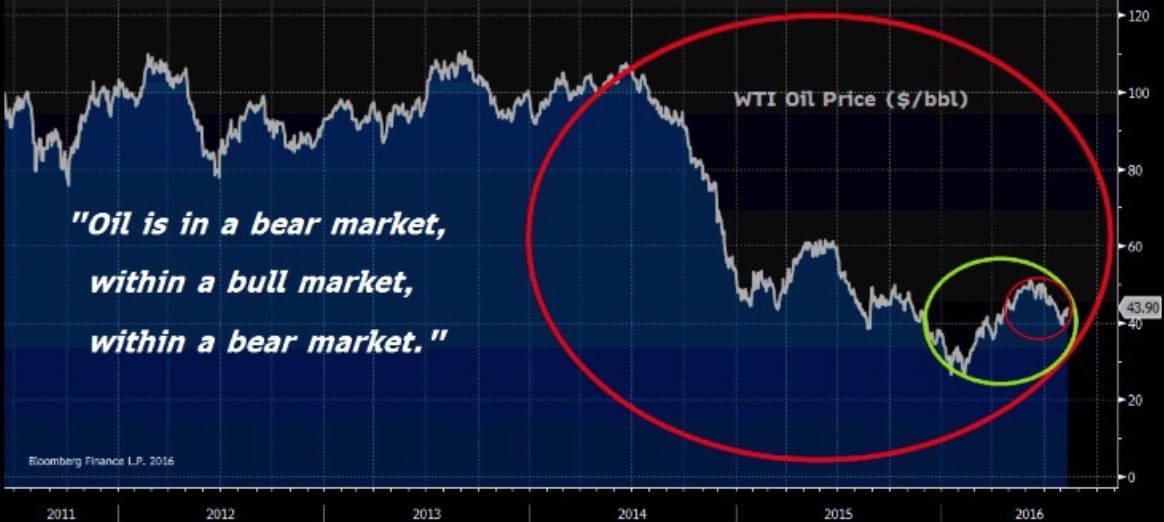
Recognize even unbiased agencies like the IEA are having trouble sorting out all the conflicting signals. Oil’s decline from $110/bbl in 2014 to a low of $26.21 last February –and about $45 today –means everyone is struggling to retool and identify a path to long term equilibrium. Drillers have slowed production volumes to ration supply and moth-balled all but the most promising wells. Bankruptcies and asset sales have concentrated firepower and operational expertise into fewer, stronger hands. It’s been painful, but forward guidance on recent 2Q earnings calls suggests some industry executives believe the market has turned and may launch a modest up-cycle in 2017.
“We are beginning to see some green shoots and key unconventional plays in the U.S. onshore business suggesting that the worse maybe behind us. We expect to see an increase in the international activity by mid-2017 as governments look to replenish some of the loss revenues with lower risk projects. Similarly, we would expect shelf and shallow-water activity to file a suit in mid to second half of 2017.”
-Jeff Bird, CEO Frank’s International NV
Frank’s International NV (FI) is the largest supplier of tubular steel pipes to the oil industry, with a 35% market share of the U.S. land market alone. As the only pure play in the business, coupled with a $581M war chest of cash and no debt, Mr. Bird has expressed openness to bolt-on acquisitions. Admittedly, he just cut the dividend and sees declining cash flow into the fourth quarter, but he sees a tighter supply balance materializing in coming months and he’s cautiously bullish 2017.
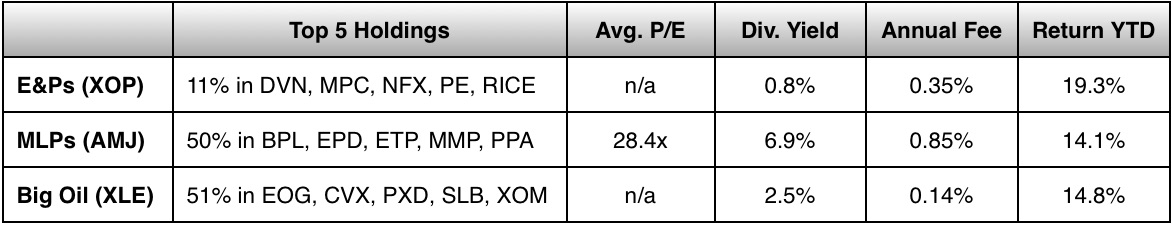
Investors apparently agree with his view, having voted with their wallets this year to lift the sector 13.8%, compared to 6.3% for the S&P 500 Index. Three energy exchange traded funds (ETFs) provide exposure with varying degrees of risk and reward, depending on your own risk tolerance: E&Ps for upside; MLPs for income; Big Oil for exposure.
The Trade
I like a combination of Upside and income, meaning I’ll get paid while I wait for my gains. So split the usual position allocation of 3% into two positions of 1.5% each, where half goes into exploration and production (XOP) and half into master limited partnerships (AMJ). Like Mr. Bird, I sense a sufficient weeding out has occurred and we can begin to think about the next up-cycle. I will also add, there is no rush to own a full position. The damage was immense, so repair will take time. Buy only on down days and pick your spots. (Note: I include the basic energy ETF XLE for your reference.)
1. Most Bang for the Buck (XOP)
Investors looking to maximize operating leverage within the energy sector should focus on the SPDR S&P Oil & Gas Exploration & Production ETF (XOP). It’s a cap-weighted portfolio of 59 companies with an average one-year Beta of 1.69, meaning this group tends to move 1.69 times more than the broader market. When oil and equities in general move higher, these stocks rise even faster. Here’s why: As oil prices rise and pumping rates increase, fixed costs can be distributed over higher per unit volumes, which drives margin improvement on the incremental barrels. Ultimately, this causes earnings to accelerate, and this is what analysts mean when they speak of operating leverage.
Investors have already begun placing their bets on this group, clearly taking the same side as the tempered Mr. Bird. XOP is up 19% YTD and shares outstanding have tripled since 2014. Holdings include well-known E&P names like Chesapeake Energy Corp (CHK), Devon Energy Corp (DVN) and EOG Resources Inc (EOG). When all the easy oil is drilled and production starts to slip, prices will have to rise to incentivize drilling and this group will benefit disproportionally.
2. Pay Me While I Wait (AMJ)
Unlike the Boom/Bust nature of the oil and gas E&Ps, the 44 companies in the Alerian MLP Index ETN (AMJ) focus on the more mundane but predictable aspects of the oil business: Storage, Transport and Processing. They are effectively the toll both operators which collect fees from oil companies. They generate significant cash flow and distribute the money to investors in the form of generous dividends. The AMJ represents 85% of total market cap for the group and pays a dividend of 6.9%, one of the highest of any ETF/ETN baskets in the world. By comparison, the widely held iShares junk bond ETF HYG yields 5.5% currently. If there’s a catch, it’s the risk of a dividend cut, though the current quarterly payout of $0.54 is only slightly below the all-time high payout of $0.60 in 4Q 2014. This group is incredibly resilient. The AMJ basket trades at a P/E of 29x and the fund’s annual expense ratio is 0.85%, so it’s not exactly cheap. Still, the 6.9% yield gets my attention.
3. Steady as She Goes (XLE)
When I was a young oil trader working for one of the largest and oldest private commodity companies in the world, Exxon’s head of trading graciously invited me to lunch. Mostly we talked about life, but I do recall a very specific comment: “Adam, once a year we figure out our drilling budget for the next 12 months. Then we put it into action, produce a lot of oil and everyone makes a lot of money.” Translation: Don’t overthink this. Companies like ExxonMobil Corp. (XOM) are slow and steady. They are aircraft carriers that require many miles to change direction or come to a stop. Just follow their wake and you’ll probably do fine. The Energy Select Sector SPDR Fund (XLE) is the largest of the energy ETFs and its expense ratio is just 0.14%. ExxonMobil and Chevron Corp (CVX) constitute a third of the index, while E&Ps represent about 40%. Oil field service and pipelines make up the remaining 25%. The XLE yields 2.8%, and if you simply want exposure without the worry, this is your index.
Energy ETF Vital Stats
Subscribe at https://bullseyebrief.com