Check-Out Time (Issue #7.2 – 6/24/16)

Check-Out Time

6 Hotel Operators to Short

  • 7 years of rising Revenue per Available Room (RevPAR) implies hotel growth is late cycle
  • Average U.S. room rate increases of 2.4% in May are the lowest since 2010
  • Hotel rooms currently under construction and/or in planning will increase total U.S. supply 10%
  • Minimum wage and AirBnB introduce significant structural challenges to hotel profitability


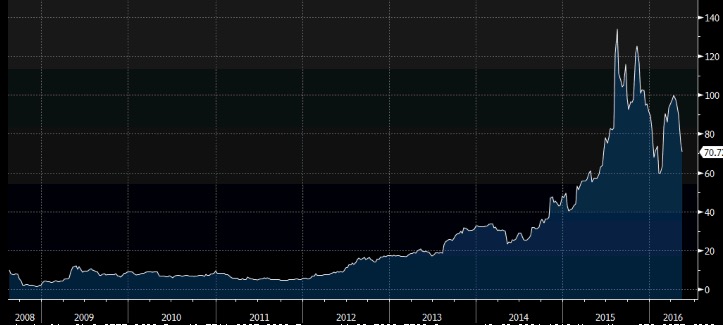
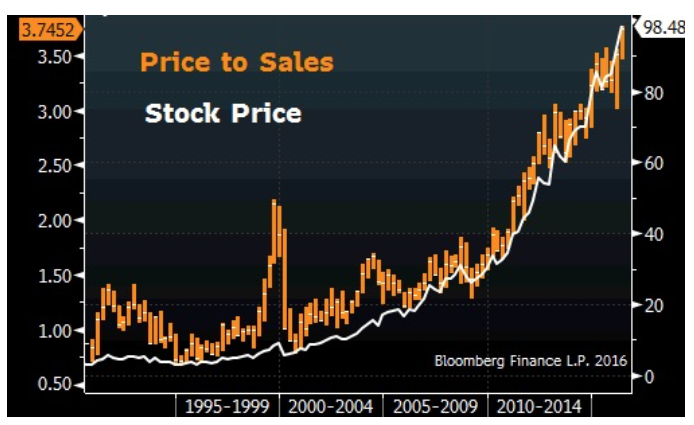
Several hotel-focused real estate executives have shared surprisingly candid concerns with me in separate conversations over the past several months. They tell me the luxury urban hotel market is oversupplied, prices paid by developers have been far too high and borrowers with weak balance sheets are about to get a very loud wake-up call. Had I not been privy to their insight, I might not have noticed. The industry‘s benchmark measure of Revenue per Available Room (RevPAR, or Rate x Occupancy) has risen each of the past seven years, the longest ever recorded cycle based on Bloomberg Industries data. Plus, hotels I visit for business are often near capacity, and just last week I got bumped on an overbooked flight to Chicago. As far as I can tell, the big city hotel biz looks pretty good.

Thank goodness for the experts, and their willingness to set me straight. Whereas I see construction cranes moving across a downtown sky as a sign of deep-pocketed institutions making significant longterm capital investment, the pros see development run amok. That 7-year high is their 7-year itch. Stepping back for a moment… #AsGoodAsItGets?

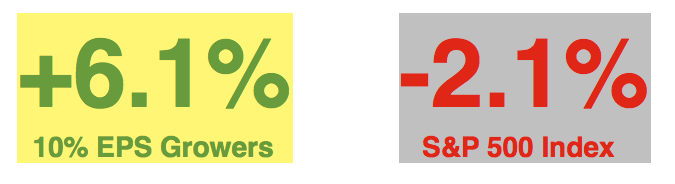
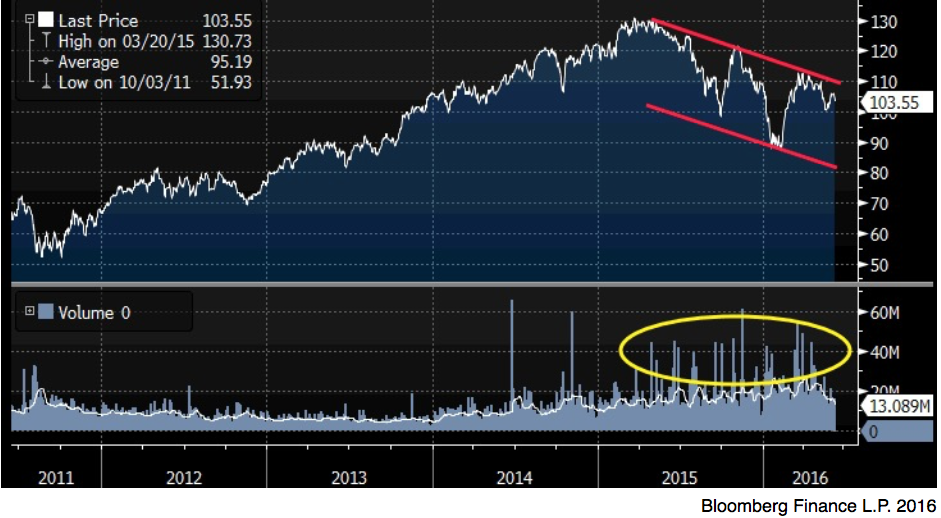
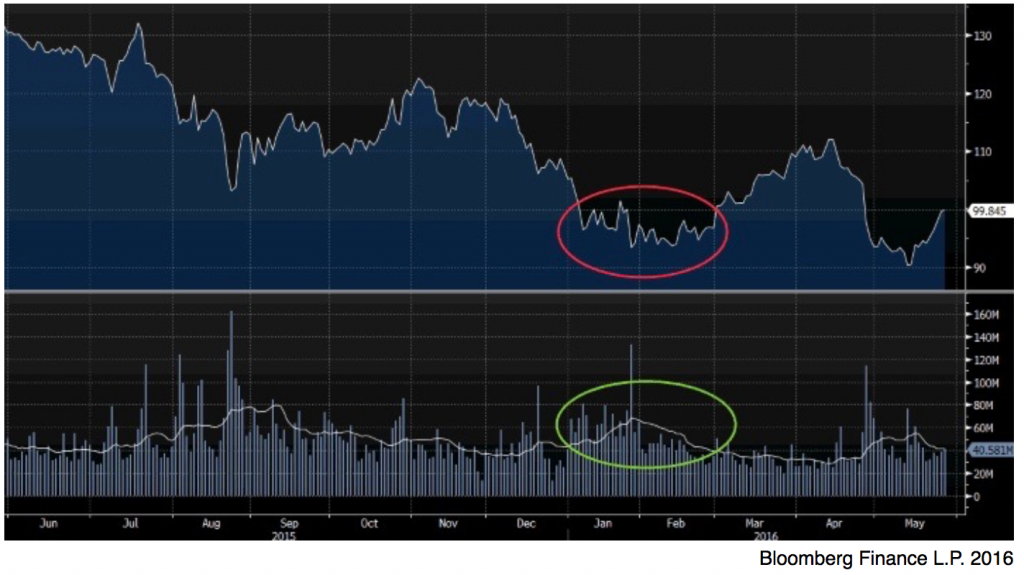
Maybe so, and investors have clearly begun to express concern. Hotel REITs –which generally own the underlying real estate and pay mid-single digit dividends– have declined over 25% from their all-time high. That’s a powerful message in a rate-stared environment. In addition, the stocks have sold off on higher volume. Again, a strong message.

Checking Out

Bloomberg Hotel Index

Oversupply

To appreciate investor’s concerns, just drive around Manhattan… or Houston, or Denver, or Portland. Construction-related traffic jams in New York City this summer have become impenetrable. Along Tenth Avenue in the 30s I recently counted 13 cranes hoisting steel as part of a Phase I redevelopment around the old Hudson Yard Railroad facility. Planners promise a new “city within the city” and when I shared my impressions with the CEO of a noted real estate development company, he told me many of those structures were financed at 2-4% cap rates (property net operating income divided by purchase price).

This means you’d need to own that building for 25 to 50 years and run it at full occupancy with no unexpected capital expenditures just to re-coop your initial investment… inflation not included. Cap rates this low are historic and likely unsustainable, which is why my friend turned down several opportunities to participate. He believes the combination of high prices paid and optimistic assumptions about growth will ultimately force several of these projects into default.

Consider this nugget from the New York Building Congress 2016 Annual Report, entitled “Sky’s the Limit.” Attention bulls: The following material is graphic in nature. Reader discretion is advised.

An amazing $40 billion worth of construction projects were initiated across the five boroughs in 2015, and the New York Building Congress forecasts construction spending will increase even further to $41 billion in 2016 and $40.8 billion in 2017. More new office space is being built than at any other point in the past quarter of a century. Spending on residential construction is at an all- time high and is likely to produce more than 90,000 new units between 2015 and 2017. New hotel rooms have been added at a blistering pace.

What’s happening in New York is hardly unique, and two key numbers prove the point:

1. U.S. non-residential construction spending of $688B is within 6% of the all-time high in 2008 (Census Bureau).
2. 509,626 new hotel rooms currently in planning and/or under construction will increase the total number of available rooms in the U.S. by 10% to 5.58M, according to figures tracked by hospitality research firm STR, Inc. The current construction/planing figure represents an increase of 19% compared to last year. READ THAT AGAIN PLEASE… the 10% part.

Hotels 3 Oversupply
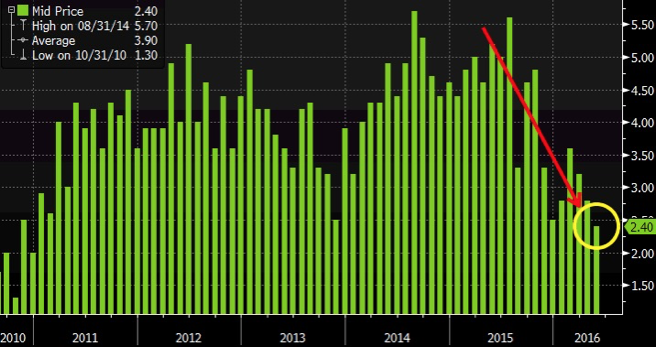
New supply pushes prices lower by definition, and Q1 rate increases nationally of 2.4% indicate the slowest advance since 2010 (Smith Travel and Bloomberg data). Even if the economy resumes 3-4% growth and corporate earnings break out of the cur rent 3 year slumber, hotels have to contend with competition from AirBnB, which now lists over 2M properties. While the company does not break out U.S. listings, its current global inventory equates to one-fifth of all U.S. hotel rooms. That is what we call a 500-pound gorilla, and its chest pounding serves as a warning to hoteliers they are expanding at exactly the wrong time.

Hotels 4 Effect of Hypothetical
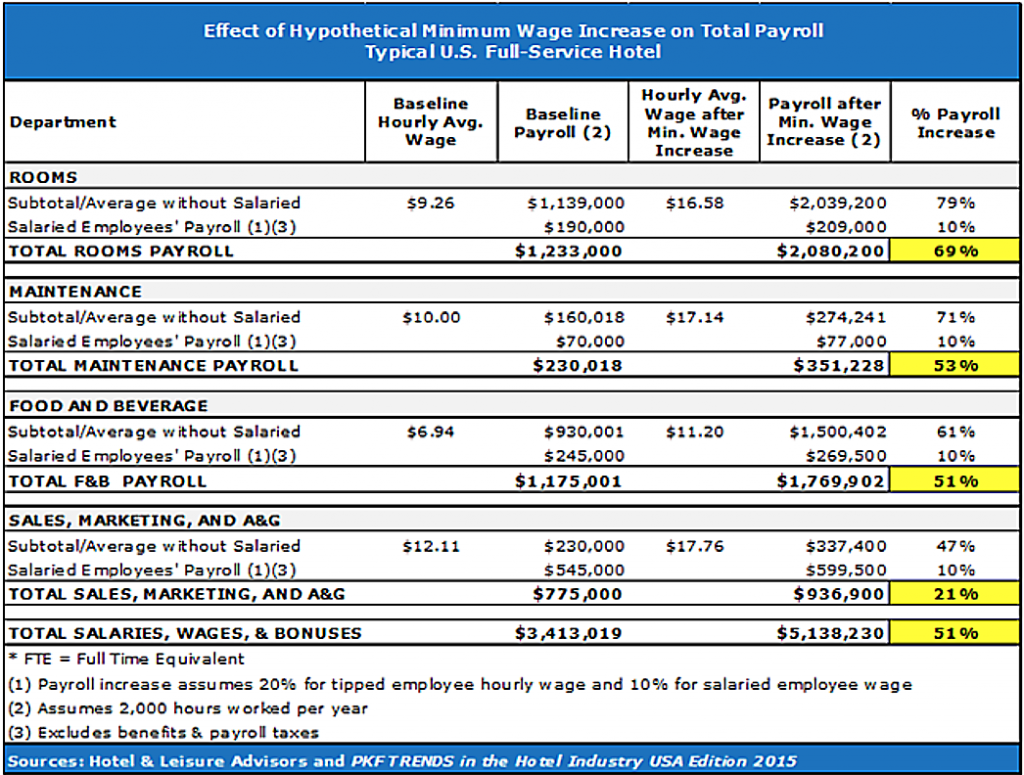
Recent minimum wage increases also present a major headwind for hotel owners and operators. www.hotelonline.com published a case study on how raising minimum wage to $15 would increase labor costs by 51% for a standard 248 room full service hotel. Since labor represents a hotel’s single largest cost component, the analysis suggests hotels will struggle to maintain profitability —
and with the economy growing <3% and supply rising 10%, raising rates isn’t viable.

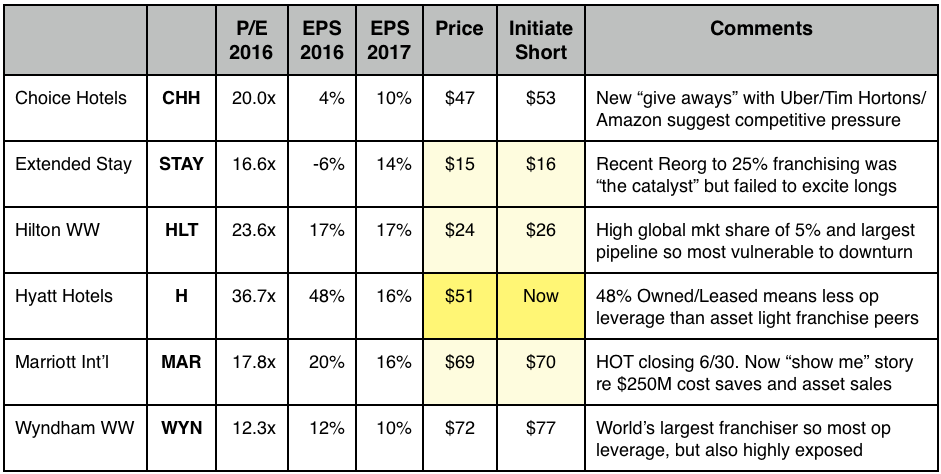
The Trade: Short the Operators

Hotels companies come in two varieties: Operators and Owners. As an example, Marriott International (MAR) manages reservations and guest services whereas counterpart Host Hotels & Resorts Inc. (HST) owns the property, plant and equipment. HST is about steady income and long-term real estate appreciation. MAR offers investors greater cyclical upside through operating leverage… in a rising market. Since shorting stocks which pay 4-7% dividends is NOT my idea of fun, I focus on the operating companies. Both groups have trended lower since last year’s peak and now trade in a very specific channel of lower highs and lower lows, giving us reasonable clarity on when to initiate short positions.

Hotels 5 Choice Hotels

Rule Britannia (Issue #7.1 – 6/24/16)

Rule Britannia

Eight U.K. Dividend Aristocrats

  • Brexit has skewered UK assets to create significant value among dividend paying companies
  • FTSE 100 Index now trades at a discount to peers despite higher GDP and lower unemployment
  • 16 of 100 FTSE components yield at least 5% compared to zero companies in the DJIA
  • Bloomberg model identifies 8 UK-based companies likely to increase dividends near-term

No man is an island. Unless he’s British. The historic #Brexit vote by 51.9% of the UK population asserts Britain as independent and unbundled from the global bear hug wrought by asset inflating central banks. While perhaps noble in its intent –even refreshing to the fiscally-minded among us– stocks plunged 9% and the venerable British Pound dropped to a 31-year low. Then something happened. Buyers stepped in. Take quality assets down far enough and value speaks for itself. UK dividend paying stocks offer particular reward.

Emotion ahead of the vote, as well as the unprecedented plunges overnight have created a some compelling opportunities for thoughtful long-term investors. With so many traders betting on a negative outcome, short interest on Sterling futures has soared to new highs in recent weeks. Similar story for the cost of transacting in the options market, where implied volatility on the currency’s options had risen 22%, more than four times the rate on the Euro. (chart from Bloomberg). RuleBritannia 2 British pound
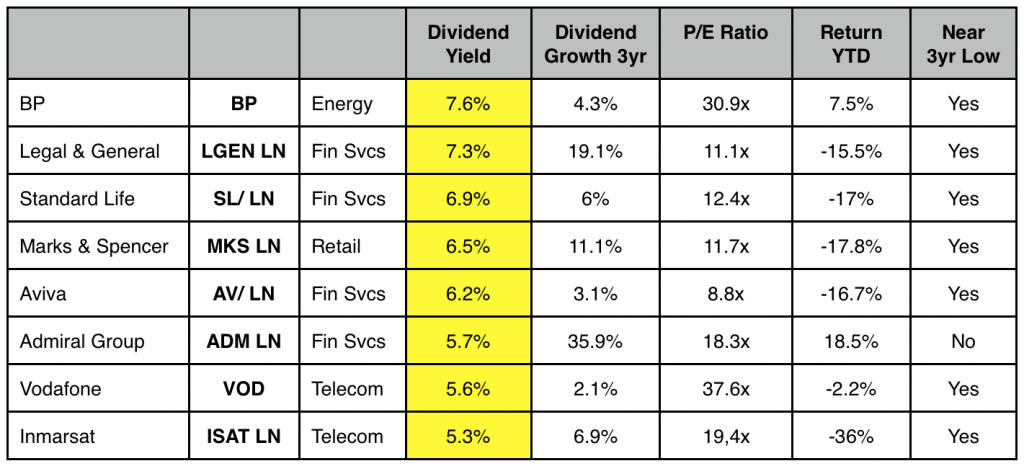
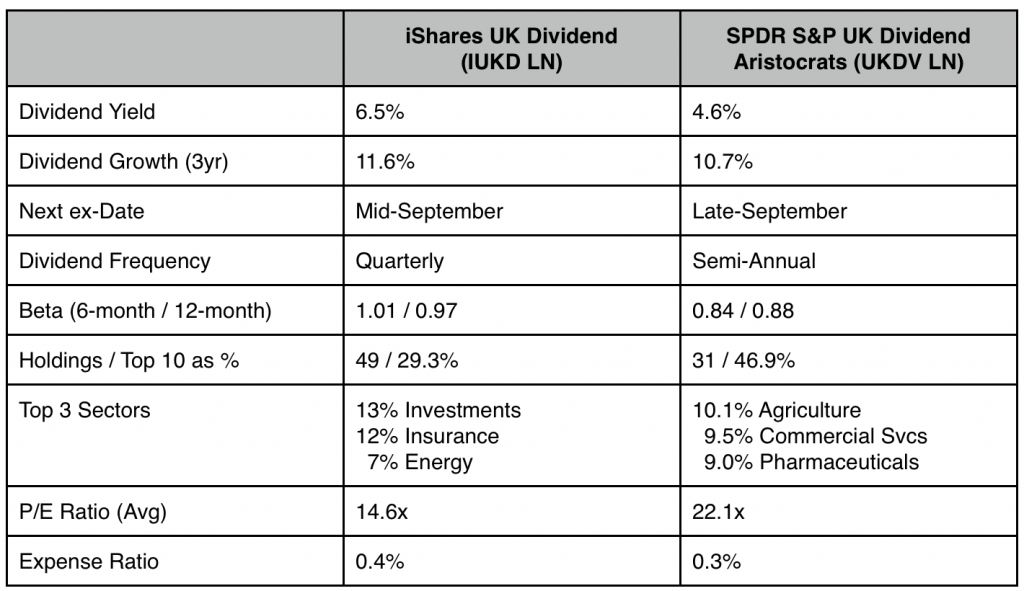
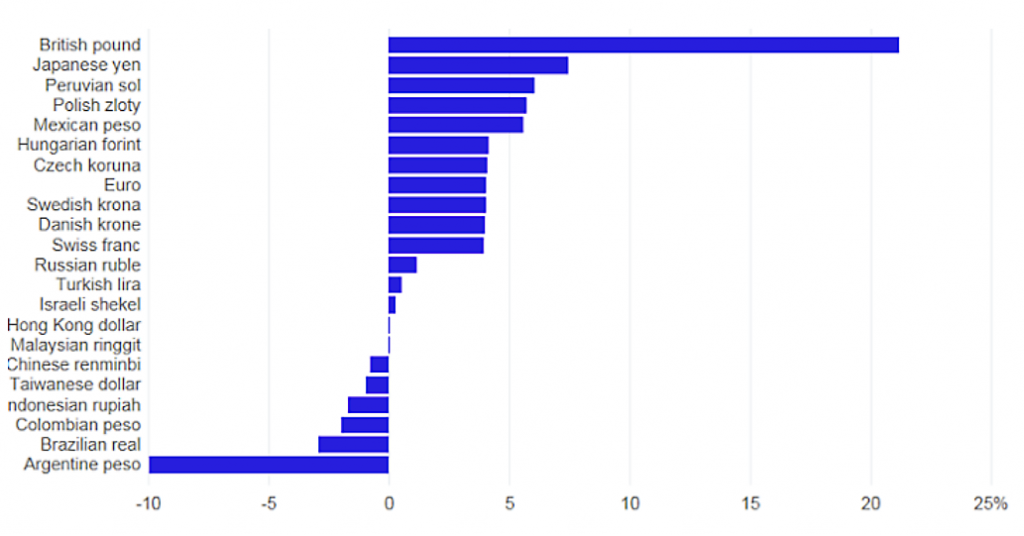
Incredibly, the GBP spike occurred even as implied vols declined for Brazil and Argentina… which feature zika and 40% inflation, respectively. Equity markets too reflect angst. #Brexit has wreaked so much havoc on valuation that only Italy trades at a cheaper ratio of price to earnings among Europe’s major markets. Yes Italy, where unemployment still hovers above 11%, more than twice that of the UK. I’m focused on British dividend paying stocks. Simply put, they are far too cheap and their dividend yields are far too compelling to ignore. Plus, earnings are rising and the cheaper Pound should help exports (assuming bitter EU ministers don’t impose punitive tariffs). Compare Britain to the rest of Europe.

What You Pay vs What You Get

Bloomberg offers users an exceptionally powerful screening function in order to identify value more specifically. In this case, I have narrowed the list of FTSE components to those few companies distinguished both by high dividends currently and a strong likelihood of dividend increases in coming weeks/months. Bloomberg’s dividend forecast model scores an accuracy rate above 91% by incorporating over a dozen factors. Some of these include estimates of cash flow over the next 12 months, historic dividend payout ratios, changes implied by forward options pricing and recent comments
by management in public forums.

Here are the key components I incorporated for this screen:

• Current dividend yield of at least 5%
• Next projected dividend action is “Increase”
• Forward 12-month earnings forecast to rise

Nine of 100 companies met my criteria. Incredibly, 16 components in the FTSE 100 yield more than 5%, while not a single member of the DJIA yields even 4.5%. This is how cheap UK equities have become. Of the eight I present, all but one trade near three year lows. U.S. investors will appreciate two of them can be traded via American Depository Receipts (BP and Vodafone), which effectively serve as proxies for the “ordinary shares” trading in London.

Eight UK Dividend Aristocrats

RuleBritannia 4 Eight UK Dividend Aristocrats

Five additional companies pay notable dividends, but did not make the cut because Bloomberg forecasts the current dividend will remain unchanged while I opted for growth. These include:

• Berkeley Group (BKG LN) at 7.7%
• GlaksoSmithKlein (GSK) at 5.6%.
• HSBC Holdings PLC (HSBC) at 8.2%
• Pearson PLC (PSO) at 7.4%
• Royal Dutch Shell (RDS/A) at 6.8%

In case you are wondering why Rio Tinto (RIO) didn’t make the cut with a trailing 12-month yield of 7.1%, Bloomberg forecasts the company will announce a dividend cut of 50% on August 3. Given Bloomberg’s accuracy of 91%, I will leave beleaguered Rio for someone else.

I recognize some readers prefer one-stop shopping, and two exchange traded funds traded in London fit the bill. The first is the SPYDR S&P UK Dividend Aristocrats Fund (UKDV LN), which currently yields 4.6% and has grown the dividend an average of 11% annually the past 3 years. The second is the iShares UK Dividend UCITS ETF (IUKD LN), which yields 6.5% and has grown its dividend 12% annually the past three years. Each includes two of the nine names from my screen, and IUKD also includes the five additional names I highlight which are forecast to hold dividends steady. IUKD is therefore closer in construction to my more specific stock screen. A few more essential points on the two funds follow.

UK Dividend ETFs

Here Today…Here Tomorrow (Issue #6.3 – 6/10/16)

Here Today…Here Tomorrow

Buy Sprint Bonds Now

  • Operating income turns positive for first time in 9 years on enterprise-wide restructuring
  • Price cuts and leasing drive subscriber growth to 3-yr high while churn to 20-yr low
  • Sufficient near-term liquidity and deep-pocketed parent Softbank underscore solvency
  • Sprint’s Jewel in the Crown is 2.5 Ghz spectrum valued at nearly three times enterprise value

Sprint wants you to know they’re here to stay, and they’ve even hired Verizon’s geeky pitch man to prove the point. His now famous tagline “Can you hear me now” will begin morphing into “Almost as good at half the price.” Okay, I’m kidding. But that’s effectively the pitch to consumers, and it’s based on Nielsen data ranking Sprint within 1% of Verizon for reliability across 104 major U.S. markets. As for cranky investors who’ve seen shares fall below $4 and yields rise above 12%, copywriters should start drafting comments about cash flow and assets. If you dig through the numbers, you will likely conclude this company is no where near Ch. 11, as the gloom crew predicts. I’m no pitch man, but if I were writing their ads I’d say simply “Buy the Bonds Now.”

I too approached Sprint skeptically at the onset, but pivoted from Doubter to Buyer once I recognized three compelling pillars which uphold Sprint as a dynamic and viable long-term enterprise:

1. More than enough capital to meet commitments through 2017
2. A committed and well-capitalized majority owner
3. Three times its own enterprise value in high quality 5G spectrum

Let’s first address the near-term, Sprint’s capital flows over the next 2 years. Using both public filings and some excellent research from J.P. Morgan Telecom analyst Philip Cusick, CFA, here’s the picture.

Show Me the Money

Sprint Liquidity 2016-17

Snew 2 Spring Liquidity 2016-17

The message here is clear: Sprint is NOT GOING OUT OF BUSINESS. With $2.8B in demonstrable liquidity through 2017, Sprint has plenty of breathing room to operate, invest and even expand. To quote JPM’s Mr. Cusik “Sprint has sufficient liquidity to work at it for at least the next 18-24 months and we are warily optimistic.” If his use of the word warily concerns you, recognize Sprint’s $31B in outstanding debt makes it the single largest U.S. high yield issuer, with half of its bonds trading at distressed levels (greater than 10%). So nay sayers have been leaning on all levels of the capital structure, though the benchmark 7 1/8 coupon bonds due in 2024 have rallied 15-20% since February lows on better than expected Q1 results.

Near-Term Fundamentals

First quarter results demonstrated Sprint’s restructuring plan is working, as management raised EBITDA guidance for 2016 to $9.5-$10B from $8.1B. Sprint has been actively driving customers to leasing plans from outright purchases which it previously had to subsidize. It has also created a leasing subsidiary which buys phones for handset makers, leases them to customers and then securitizes the cash flow as an asset backed-transaction. Japan’s Mizuho Securities led these two most recent MLS transactions and we will likely see more.

Snew 3 Postpaid Phone Subscribers
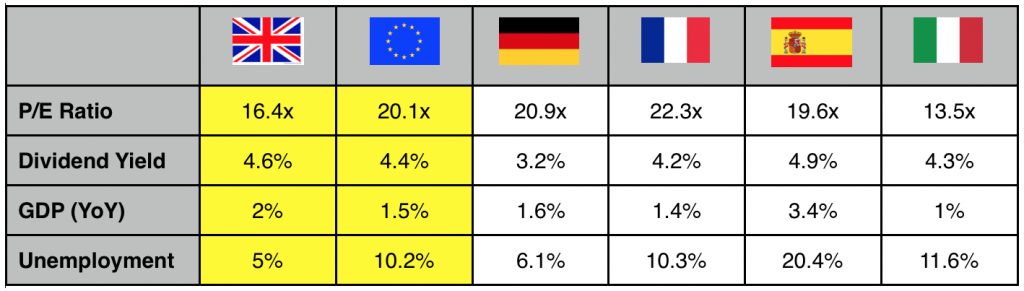
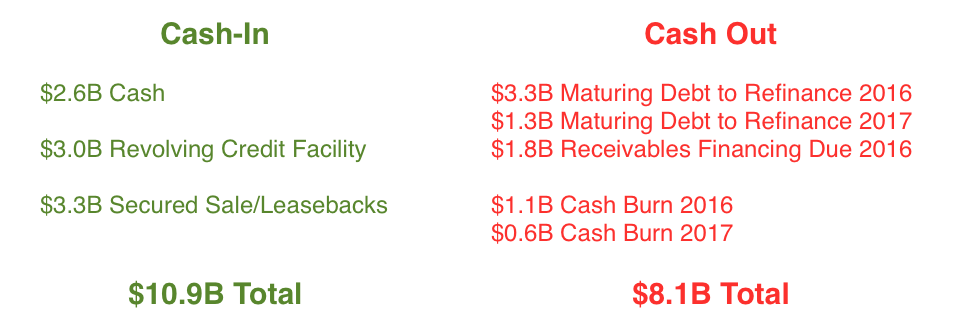
Additionally, Sprint has targeted $2B in cost savings through 2017 as it streamlines operations across each unit. The CFO has even set up a separate cost control War Room where every single layer is analyzed enterprise-wide. So far, the $250M quarterly run rate is right on target. Admittedly, the one thing we don’t like is lowered capex spending from $5B to $3B because it slows the move to 5G, where Sprint’s superior 2.5GHz spectrum is its jewel in the crown (more on this on a moment).

As for Sprint’s core business of signing up people for wireless service, net subscriptions YoY have risen for 6
consecutive quarters. Critically, Sprint is adding subscribers, as opposed to simply no longer losing them at lower rates. Yes, Sprint is actually gaining subscribers… 22k in Q1 (blue line). Note the head to head decline versus
AT&T (white line). Equally important, the savage price war which has cut the cost of plans in half since 2013 may have hit bottom. Ultra aggressive discounter T-Mobile has quietly begun raising data plan prices by $5-15 per month. In a business where four providers provide nearly 100% of the service (AT&T, Verizon, T-Mobile, Sprint) even small price increases are significant.

Long-Term Fundamentals

The massive increase in the flow of data has forced carriers to pursue multiple new approaches to wireless transmission. This includes aggregation, where carriers compress data and consolidate channels into a single pathway. It also means beaming signals directly versus random scanning, and creating micro cells in tight urban environments. Phd types from M.I.T. refer to these new protocols as densification, and suffice to say no U.S. operator has more spectrum depth to “densify” its network and deliver more capacity than Sprint. This is due to its market leading ownership of 2.5 GHz spectrum essential to driving data across next generation 5G networks.

Bloomberg Intelligence analyst John Butler estimates the value of Sprint’s 5G spectrum at $137B, which is nearly three times Sprint’s entire enterprise value of $46B. So if Sprint suddenly filed Ch. 11 tomorrow and liquidated assets, a judge would be in the highly unusual position of sorting out who gets $109B in cash, assuming the spectrum went on the market and attracted competitive bids. John’s estimate is based on comparable valuations for recent secondary market transactions. He says even if he uses a more conservative approach, comparing Sprint’s spectrum to AWS-3 bands, he still pegs the value at $85.6B. Since Sprint owns more 2.5Ghz spectrum than its competitors, and this spectrum is essential to
future 5G buildout, I would argue Sprint owns more “future” than its competitors. I want to own a piece of Sprint, and I think high yielding bonds are the best way to get paid for my involvement.

One more critical point before I get to my two trades…

Never underestimate the impact of a mentor. Mentors open doors, run blocker, mend fences and in some cases mentors help make ends meet. Sprint has a mentor in SoftBank CEO/Founder Masatoshi Son. SoftBank owns 83% of Sprint and currently has $22B of cash on its balance sheet. It also owns 28% of Alibaba (even after its recent 4% sale which raised $8.9B in cash). The point here that Sprint has a very deep-pocketed and well connected parent. While rating agencies debate the staying power of Sprint, I say simply look to the parent. Saving face is a deeply-rooted cultural identification in Japan, and the thought of a highly visible Japanese parent letting an investment of Sprint’s magnitude go under is simply
unthinkable. If things really got bad, Sprint could certainly turn to SoftBank.

So… rising EBITDA, growing subscriber base, successful restructuring, valuable assets, wellcapitalized parent and sufficient cash flow to meet debt service and capital investment —> That’s Sprint.

The Trade

1. Buy Sprint 8 3/8 bonds of 2017 yielding 5.24%. These bonds provide more than adequate compensation at 5.24% for a business which clearly has sufficient capital to operate and grow between now and next summer (August 2017 maturity).

2. Buy Sprint 7 1/4% bonds of 2024 yielding 11.43%. This long-term position provides both compelling yield AND the opportunity for significant capital appreciation. It offers the most attractive “convexity” of the longer term bonds, a fancy way of saying “bang for the buck.” Convexity measures the relationship between price and yield. In this case, a 300 basis point decline in yield (meaning the market perceivesless risk and bids up the bonds thereby reducing yield) would generate a 20% increase in price. That’s bang for your buck. So you’re being compensated near term for what I believe is quantifiable risk, and offered the possibility of significant capital growth as perception of Sprint improves.

As for the equity, it’s less compelling. There is no dividend and earnings per share are flat. Sprint is less about operating growth and equity appreciation, more about viability and cash flow. I like Sprint’s bonds, particularly at these yields.

Burning Down the House (Issue #6.2 – 6/10/16)

Burning Down the House

Housing’s 3 Dos & 1 Don’t

  • Existing home sales still 23% below trend despite record U.S. personal income
  • By contrast, spending on renovations and repairs is up 27%
  • Bloomberg Homebuilders Index trades at 1.3x book value vs 0.77 in 2007
  • Home Furnishings group offers better value and superior earnings growth


Everyone’s an expert on housing until it’s time to sell, and then you pray for a bid. This week I have read multiple research reports from some of the highest-rated analysts on Wall Street who extoll the outlook for housing. To quote the team at Wells Fargo, “All year we have been making the case that 2016 would be a break-out year for homebuilding, and finally the data are beginning to support our argument.” Only problem, strong data in April does not a trend make, and Easter in March won’t happen again til 2035, so April may have been just another head fake.

In fairness, the bullish case for housing hinges on far more than one month’s figures. Powerful underlying demographics suggest the U.S. housing market is a coiled spring ready to unleash significant momentum:

• U.S. Unemployment has fallen to 4.7%, the lowest since late 2007
• U.S. Disposable Income has surpassed the pre-crisis high by 21% to $13.9T
• 12% of employers plan to raise wages in the next 12 months according the the NFIB
• New household formations of 538k this year remain 41% below the 25-year average
• U.S. Personal Savings rate has risen to 5.4% of income, more than double the pre-crisis rate
• Gasoline costs remain 33% below 2013-14 levels
• 30-yr fixed rate mortgages remain near record lows at 3.73%

So we have seven compelling reasons why home sales should be through the roof, yet they’re still just a fraction of the pre-crisis high… and 23% below trend according to Bloomberg Intelligence. I cannot even imagine the closed door conversations at Janet Yellen’s Fed, or the table pounding in conference rooms at the homebuilders’ offices. If ever the stars had aligned in favor of housing, surely this is it.

Housing’s Disconnect

Buyers Have Money But Aren’t Buying

For all the logical reasons why buyers should be buying, they are not. Maybe they don’t like the fact that home prices have rebounded nationally to within 10% of all-time highs per Case-Shiller data. In “hot” markets like New York, Portland and San Francisco, tight rental conditions and high end condo prices have gone well past old highs, though my friend Jonathan Miller of Miller-Samuels Inc. assures me the trends won’t last. He says asking prices for the top-end have come down 5-10%, and by top-end he means +$5M. Let’s just say that’s a little north of where I shop, but his insight is corroborated by the recent announcement from Equity Residential (EQR) that new leases are falling short of estimates. This revelation in the first week of June had a somewhat chilling effect on fellow REITs Avalon Bay Communities (AVB), Essex Property Trust (ESS) and UDR Inc. (UDR).

If I sound negative, please forgive me. I am desperately trying to embrace the data and likewise the stocks. However I am troubled by the disconnect in the first chart, and even more so by investors’ unbridled enthusiasm for the group. As an example, homebuilder NVR, Inc. earned $103.93/share in 2007 and will likely earn $109.52 this year based on consensus estimates tracked by Bloomberg, an increase of about 5%. Meanwhile the stock has risen 183% over the same period. Think about that… 5% earnings growth, 183% stock appreciation. This is not rational.

NVR may be the poster child for unconditional love, but there’s plenty of hand-holding to go around. Consider Toll Brothers (TOL) and Lennar Inc. (LEN). Earnings have fallen 40-50% compared to pre-crisis highs, but the stocks are only down 20-30%. Investors don’t want to miss the bounce. Also important, while current P/E ratios don’t appear high compared to the S&P 500 Index, they are high historically. Homebuilders tend to trade cheap… like supermarkets, autos and airlines. In addition, the 19 homebuilders in Bloomberg’s proprietary index currently trade at an average of 1.3x book value, a significant PREMIUM to the 2007 average of 0.77x. If you think homebuilders are currently cheap, please think again.

Devil’s in the Details

Perspective on Homebuilders

BurningHouse 2 Perspective on Homebuilders

Fortunately, not all the data are bad. In fact, the renovation and home improvement market appears quite healthy. Home spending rose more than 27% in 2015 according to the U.S. Census Bureau, the highest since 2005 and well above historical norms.

Record earnings coupled with mid-teens growth at both Home Depot (HD) and Lowe’s Home Improvement Centers (LOW) confirm the trend. People may not be buying homes, but they are certainly taking care of the ones where they live. The point here is this: We can play the strong demographic case for housing without buying the homebuilders. We can simply buy all the stuff that goes into making homes look their best: Cabinetry, Flooring, Fixtures and Paint.

So in our binary world of Housing’s Dos & Dont’s: Don’t buy the homebuilders… Do buy the home furnishers. Here are three in particular:

1. Mohawk Industries Inc. (MHK) is the largest global flooring manufacturer, controlling 21% of the market according to Floor Focus Magazine. Demand for its core products (Laminate/Wood/Ceramic/Carpet) is growing mid-single digits, while earnings are growing an average of 20-25% on a combination of leveraging fixed costs thru merger synergies and $600M in capex to improve high margin businesses. The company has beaten earnings estimates in 17 of the last 18 quarters and raised guidance after the Q1 report. Mohawk reports Q2 earnings on June 16. It currently trades at 16.2 times earnings, cheaper than the S&P 500 with 3 times the growth.

2. Masco Corp. (MAS) derives 83% of sales from Repair & Remodeling as a leading manufacturer of building products in four primary segments: Plumbing (47%); Decorative Architectural Elements (28%); Cabinets (14%); Specialty/Custom (11%). Management recently guided to 7% annualized sales growth and 16% operating profitability on its recent restructuring, which consolidated production into fewer facilities and cut debt by $400M. 17 of 24 analysts tracked by Bloomberg rate MAS as a buy (no sells) and on average they forecast 8% free cash flow growth. The company intends to deploy $2B through 2017 on repurchases, dividends, debt reduction and bolt-on acquisitions. With earnings growth forecasts of 28% this year and 20% in 2017, MAS trades at 20.8x 2016 earnings, a slight premium to the S&P 500 Index.

3. Sherwin-Williams (SHW). I admit this one gives me slight pause, trading 23.1 times 2016 earnings and very close to all-time highs. Yet the fundamental story is very solid. Its $11.3B pending merger with Valspar will generate combined pro-forma sales of $15.6B, making it the global leader in paint manufacturing and distribution. Strong M&A synergies suggest incremental EBITDA margins between 30-40%, which is in part why the deal is immediately accretive. SHW’s 4,300 retail paint stores generated same store sales growth 9.4% in Q1, and the partnership with with Lowe’s produced 7.4% gains. Since house paint accounts for 77% of SHW sales, the Repair and Restoration thesis is clearly playing out in the results. There are three risks to this story: Merger Integration; Continued low raw material costs linked to commodity prices; overall valuation. Sherwin-Williams is a stock to own at the right price. So put it on the radar and buy on down days. Generous options premiums also make it an excellent candidate for covered call writing (Long stock and short call). For example, buy the stock at $290 and sell the July 290 call at $8 for a 3% cushion, that’s a 26% annualized return.

Band-Aids, Beverages & Bleach (Issue #6.1 – 6/10/16)

Band-Aids, Beverages & Bleach

11 Staples with No Shelf life

  • Consumer staples have outperformed the S&P 500 3 to 1 since 2007
  • Staples relative outperformance now exceeds 2 standard deviations (statistically significant)
  • Historically high multiples have side-lined one of the sector’s most active serial acquirers
  • 11 select staples cost more than the S&P 500 Index, yield less and are growing slower


Consumer staples are notoriously boring. They sit on the shelf for weeks, get used for an instant and stashed away ‘til next time. What a shame we pay so little attention. Consumer products companies have outperformed the S&P 500 Index by a 3 to 1 since 2007. From Boring to Best, consumer staples have constituted one the greatest stealth rallies of all time. First they held their ground when markets imploded, then their valuations soared as investors sought cash flow and dividends. Right on cue, PowerShares even dreamed up an exchange traded fund called the Consumer Staples Momentum Portfolio (PSL). Staples and momentum all rolled into one.

Staples’ outperformance has been epic, but may have run its course argues my friend Ryan Thibodeaux of Goodwood Capital Management in Baton Rouge. As the Fed normalizes rates, he reasons the sector’s dividends offer less appeal, especially at multiples which average 22.3 times earnings. Consumer staples trade at a 27% premium to the broader market, second highest among the 10 S&P Industry groups.

The best way to appreciate how far Staples have come is the following graphical depiction courtesy of Bloomberg. At the top you can see the Consumer Staples Select SPDR Fund (XLP) and S&P 500 Index (SPX) performance expressed in percentage terms since the market’s pre-crisis high in 2007. They have risen 86% and 34% respectively. The panel below shows the spread between the two, which is currently at 52 percentage points (86 minus 34). To the side, you have the distribution of observations weekly since 2007. Note the current reading of 52 sits at the upper “tail” of the bell graph because it is such an extreme reading. At 2.06 standard deviations from the mean, the current gap ranks in the 96th percentile.

Boring No More

Staples Trounce Market

Prior to the financial crisis, consumer staples rarely outperformed the broader market for extended periods, and especially by such magnitude. While they’ve had moments in the spotlight, like after the NASDAQ tech crash of 2002 and the sideways markets of the mid-90s, staples have taken a logical back seat to higher growth sectors. Their appeal has largely been as a safe haven during time of stress, cushioning portfolios with steady dividend income supported by predictable, if somewhat unglamorous businesses.

So the real question at this point is whether something has changed, such that paying a premium for stocks yielding only marginally more than the risk-free rate on government bonds no longer makes sense. I would argue yes, something has changed, courtesy of Fed Chair Janet Yellen fro her speech May 27:

“It’s appropriate for the Fed to gradually and cautiously increase our overnight interest rate over time… probably in the coming months such a move would be appropriate.”

Shout it from the rooftops: No more life support. With U.S. Personal Consumption and Core PCE Inflation both rising 2.1%, the patient can go home. With the U.S. 10-year Note yielding 1.9% and likely heading higher, dividend yields in the the 2s no longer make sense. Staples’ 9-year run, and current premium valuation has morphed from something to celebrate into a something to avoid. Yes, avoid.

Case Study: Church & Dwight (CHD)

Church & Dwight owns a portfolio of well-known consumer brands and has achieved a cult-like status among analyst for its ability to grow successfully through acquisition. Recently however it has had to rely more on operational tweaks to generate earnings improvements, as prices for potential targets have inflated to the point of being uneconomic. Like the company’s own stock, which trades at 29.7 time earnings, even great brands become unattractive investments above a certain price.

The following conversation between CEO Matt Farrell and Goldman Sachs analyst Jason English is particularly telling. It occurred May 12 on stage at the Goldman Global Staples Forum. While Jason is a long-term believer in management, he currently rates CHD a SELL.

JE: So, it’s a question of diversification versus building on what you have. Can you comment on that, and then the M&A dialogue overall.

MF: The short story on categories is that we are a serial acquirer. In the year 2000, we owned Arm & Hammer, today we have 10 brands that account for 80% of our revenues and profits. So, 9 of those 10 were acquired. The 10 brands today, we want to have 20 brands tomorrow, it’s just simple as that.

JE: You’re focused on delivering long-term with M&A. Keeping pretty disciplined in what you buy, [transactions] have generally been modestly accretive and given your growth ramp going forward, it’s harder to do that with the multiples where they’re at today.

MF: The multiples are high to acquire things today. We’ve paid some big multiples in the past, but not more recently. Oxiclean was a 17x multiple. We’re focused on a synergized EBITDA multiple and whether we can we get that number down under 10x. So would you pay 15 times? Absolutely, but that’s trailing. So my question is can you count on cost synergies to get you down to where this makes economic sense. We look at a lot of deals, we haven’t done a larger one in four years.

And that’s the whole point: One of the best operating CEOs in the business won’t commit capital. So why would you?

There are several important points here:
1. The fact Mr. Farrell would go on stage with an analyst who openly rates his company as a SELL is almost unthinkable, and yet there they sat side-by-side, even taking questions from the audience. They are the experts, and they are telling us their sector is overpriced.

2. Staples are attractive in uncertain times because their stable cash flow businesses support reliable dividend income, but at high multiples yield compresses by definition. The benchmark Consumer Staples ETF (XLP) yields just 2.0%, barely above the “risk free” rate on the U.S. 10-year and LESS than the yield of S&P 500 Index.

3. So not only is valuation unattractive, so is yield.

4. Finally, these companies grow very sloooooowly… historically 2-4% annually. So absent value and yield there is no compelling reason to own these names.

How High the Moon

Church & Dwight (CHD)

As the stock prices of companies like Church & Dwight rise to new all-time highs, valuation metrics like Price to Sales (P/S) become similarly extended. The uptrend has been incredibly persistent, but equally contingent upon growth by acquisition, which is no longer happening. In addition, interest rate normalization by the Fed will create risk-free rates of return which provide viable competition for dividend paying stocks.

As such, the consumer staples sector is ripe for correction, even well-run companies like Church & Dwight. Low-growth, low-yielding, high-priced stocks do not merit record valuations as the Fed tapers policies which fueled their gains in the first place.

Eleven of 54 consumer staples in the combined S&P 500 and S&P 400 (mid-cap) indicies fall into this category, based on the following criteria:

• Price to Earnings (P/E) > 21x
• Price to Sales (P/S) > 2.0x
• Sales Growth (3yr average) < 6%
• Dividend Yield < 3%
• Analyst Sells/Holds significantly exceed Buys
• Consensus target is no more than 7% above current stock price

The data follows, and I have flagged in yellow specific metrics which cause alarm. Simply put, the more yellow the worse. I would NOT own them. To the contrary, they are excellent short candidates.. AGAIN, not simply because of valuation and low growth, but because normalized interest rates undermine the dividend thesis which has propelled them for several years. They are no longer safe haves, they are capital traps.

Too Much for Too Little

Consumer Capital Traps

Growth Where Art Thou? (Issue #5.3 – 5/27/16)

Growth Where Art Thou?

4 Countries Apples Needs to Conquer

  • Buying by Apple’s top 25 shareholders during Q1 downturn exceeded selling 3 to 1
  • Apple accounts for 13.4% of global smartphone sales according to IDC
  • China and India represent a market potentially 8 times larger than the U.S.
  • Every 1% gain in market share raises Apple net income by half a billion dollars

Apple CEO Tim Cook has flown the coop, and it’s about time. Two weeks after reporting Apple’s first quarterly revenue decline in 13 years Mr. Cook fired up the iJet for a high octane global scouting mission. He spent two days in China, four days across India and quick layover in Amsterdam, where he joked about spotting an iPhone in a painting from 1670. While the press had a field day with that one, as the paint’s title is “Man Handing a Letter to a Woman in the Entrance of a House” the metaphor is clearly appropriate. Mr. Cook is passing notes, pressing the flesh, and opening training facilities in Bangalore to seek out growth overseas as the U.S. matures. Only one word matters in Apple’s world now: iGrowth.

Mr. Cook appears to have embraced his new calling, and Masters from above are nodding in approval. Apple’s top 25 shareholders collectively own 35% of all shares outstanding, and they bought a net of 84M shares during the weakness in the first quarter. Purchases outweighed sales by a margin of 3 to 1 and include significant commitments from Capital Research and Norway’s Norges Bank, the world’s largest sovereign wealth fund. Warren Buffet notably bought $1B shares as well. These are not coupon collecting, or dividend seeking pensioners. They are growth oriented, value conscious and they bought in size. Higher volume in the hole –especially by such strong buyers– is compelling.

Buffett: Quality Merchandise Marked Down?

Apple (AAPL)

AppleBB Apple (AAPL)


When 13D filings revealed the large Q1 purchases in April, talking heads took to the airwaves and proclaimed Mr. Buffett’s appreciation for “quality merchandise at a discount.” They argued Apple had clearly gotten too cheap at a mere 10.4 times earnings and big value buyers couldn’t resist. There’s only one problem with the pure value theory: it’s one on dimensional. Norway’s sovereign already receives plenty of dividends in the form of oil royalty payments from its North Sea fields. Its mission is to redeploy that capital around the world to power more growth, not collect more income. Likewise, Mr. Buffett buys uniquely positioned. cash generating businesses with a definable runway for long-term organic growth. Yes, of course the entry point is important… that’s why top holders bought in the low $90s, but owning Apple now is more about growth than value. YES, growth.

If you’re wondering how the world’s largest company can get back to being a growth stock, and not simply a dividend-paying utility, look no further than where Mr. Cook chose to spend the majority of his time and effort overseas: China and India. They are the two most populous countries in the world at 1.38B and 1.33B respectively. Their combined 2.7B people account for one-third of the world’s population, and collectively they outnumber the U.S. by 8 to 1. Their economies are growing 3-4 times faster and putting cash in the hands of millions who could become Apple customers. Never has Mr. Cook’s mission been more obvious.

AppleBB Apple Needs to Make This


These two markets are incredibly important for Apple right now. Saying so is almost an absurd understatement. True, Apple manufactures many of its products in China and already has a strong foothold, but smartphone penetration is still only 40%. In India the iPhone represents just 2% of sales, and smartphone penetration is less than 15%. Given a global average selling price for the iPhone of $671 and Apple’s 22% profit margin, Apple nets $147 per phone… arguably even more when booked through foreign subsidiaries away from U.S. taxes. So every 1% market share gain of 1M subscribers in India alone generates $147M, lifting net income per quarter by 2%. Globally, a 1% gain generates half a billion.

Are you beginning to see the opportunity here? Apple is not about value. Its about growth. Apple needs to take its iPhone franchise on the road and grow it.

Bloomberg News reported Mr. Cook announced an India game plan which includes multiple retail flagships, an iOS developers accelerator and a research facility to house the digital maps business. Prime Minister Mothi discussed the expansion with Mr. Cook over a private dinner, but also requested Apple source 30% of components locally. It’s called one hand washes the other and it’s not new. Just as BMW and Airbus manufacture on U.S. soil, Caterpillar manufacturers on Chinese soil. Mr Cook, do it.

As well-known VC investor Fred Smith of Union Square Ventures has made clear, Apple investors don’t need “another iFlop” like the iWatch. And much as they may want an iTV or an iCar, there’s nothing in the offing. So Apple needs to do what it does well and sell more iPhones. In fact, here are the four countries Apple Needs to Invade:

1. India
Samsung is crushing Apple in India, with 26% marketshare of the smartphone market according to data from Counterpoint Research. In fact, Apple isn’t even in the top five. Its sales of roughly 2 million units during 2015 amounted to about 1% of India’s total smartphone market. Even after offering discounts of up to $500 on the 6 and 6E, Apple struggled to gain traction against local manufacturers. This is why Apple needs flagship stores on the ground and in front of people. It’s about engagement, which is why funding a local incubator for iOS developers is equally key. Influence the future influencers. Win India.

2. Indonesia
Indonesia’s 260 million people make it the fourth most populous country in the world behind China, India and the U.S. Indonesia’s economy is the largest in Southeast Asia and its GDP per capita ranks eighth in the world. Apple opened a corporate office in 2014, but it has no branded retail presence. If there’s a stumbling block, it’s infrastructure. 3G technology is still the norm and only about a quarter of the population has a smartphone, but therein lies the opportunity. Apple needs to partner with local telecoms to ramp up a shift to 4G, maybe even reach out to the government under Foreign Direct Investment programs. Indonesia is a member of the G-20 and Apple should be doing business there. Think hearts, minds and infrastructure, plus 260 million people.

3. Brazil
As Mr. Cook goes west, I urge him to go south as well. Brazil ranks fifth in the world by population with 210 million people, and while millions more will arrive this summer for the Olympics and World Cup, they’d better not drop their phones taking pictures. Brazil has only two retail stores, about one per 100 million people. By contrast, Apple operates 268 stores in the U.S. California alone has 54 stores, and Manhattan has 7… three of which are within walking distance of each other. Android phones have captured nearly 80% of the smartphone market in Brazil, compared to Apple’s 12%. TechInsider compared prices for Apple products in Brazil to the U.S., and suffice to say the 60% flat tax on imported goods probably explains the overwhelming popularity of locally made Android phones. But here again it’s about hearts and minds. If any company can afford the lobbying, or in-country production facilities necessary to win local business, it’s Apple.

4. Mexico
Apple announced plans in January to open four stores in tenth most populous Mexico later this year, two in Mexico City and one each in Guadalajara and Monterrey. Research from Statista pegs the number of smartphone users in Mexico at 42 million (about a third of the population) and forecasts an increase to 62 million over the next three years. BlackRock CEO Larry FInk penned an article in 2014 imploring Millenials to set up shop in Mexico, “What sets Mexico apart is a combination of key factors for success: a diverse set of resources and industries, its proximity to the world’s largest economy, a relatively stable currency, and—critically—a proactive, democratic government… if I were starting my career, I’d try my luck in Mexico.”

Mr. Cook knows what he needs to do and he is doing it. His largest investors are buying three times as much stock as they are selling, and at $100 Apple trades for 12 times earnings, which is about two-thirds the value of the S&P 500 Index. Apple stock is cheap and it’s CEO has a growth plan. Buy Apple.


Apple Key Metrics

Bloomberg Data


AppleBB Bloomberg Data

Bitcoin Grows Up (Issue #5.2 – 5/27/16)

Bitcoin Grows Up

Five Blockchain Blockbusters

  • Blockchain protocol pioneered to settle bitcoin transactions could transform money transfer
  • Goldman Sachs, J.P. Morgan, IBM and Microsoft are investing in blockchain partnerships
  • Citi Research identifies 20 businesses ripe for blockchain disruption
  • Several consortiums threaten PayPal’s P2P franchise

CEO Bob Griefeld is a pretty cool cat. He’s the one who showed up next to Mark Zuckerberg for Facebook’s IPO wearing the spayed-on mock-T straight out of Star Trek, launched a first-ever public marketplace for private companies the following year, and is now bringing bitcoin back to life… sort of. This latest venture revolves around a revolutionary technology called blockchain, originally pioneered to settle bitcoin transactions. If you’ve never heard of it, suffice to say blockchain is capable of clearing trades in seconds versus days thanks to simultaneous reconciliation by all clearing parties which makes fraud virtually impossible. Mr Griefeld’s team is so excited by blockchain they mentioned it 45 times during a conference call with investors on March 31.

Star Trek and other moonshots aside, the promise of blockchain as a viable alternative to outdated clearing systems has convinced some of Wall Street’s largest banks to invest millions. In February, Goldman Sachs and IBM joined 13 other institutional investors to fund a privately held Digital Asset Holdings, a pioneer of blockchain technology. Per the joint press release:

“The addition of Goldman and IBM in Digital asset will continue to help drive the global adoption of this transformative technology… Blockchain holds real potential to transform a wide range of industries… improving efficiency while reducing cost, latency, errors, risk and capital requirements.”

The key to blockchain is an innovation called distributed ledger, where all parties involved in a payment stream are aware of the transaction in realtime, and they attach their own unique security codes to effectively “solve” the clearing process. Rather than wait on each step in the daisy chain linearly, which can become problematic across time zones and with multiple currencies, each partner matches it’s own action with the anticipated entry on a shared ledger. Any discrepancies become immediately apparent, and settlement can occur much faster. Once a transaction has been verified across the network, the corresponding “block” of data is appended to the “chain” of previous transactions, hence the name.

More Points of Contact

Blockchain vs Central Clearing

BitcoinGrowsUp Blockchain vs Central Clearing


One of the defining characteristics of blockchain is decentralization, another is trust. The notion of a distributed ledger, where all parties see all transactions, appears like an intentional abandonment of privacy. In fact, it’s more a reflection of transacting parties opting to communicate directly rather than through an empowered central clearing entity. Think open software like Linux or Android. That said, Morgan Stanley bank analyst Betsey Graseck, noted in recent research on blockchain that no policymakers she interviewed would endorse an “unpermissioned” distributed ledger.

So at this point, the consortiums pursuing the concept are doing so largely away from governmental eyes. Like Uber, they are disrupting a decades-old framework, largely absent regulatory input. The three most notable partnerships include the aforementioned Digital Asset Holdings, a second IBM-backed venture in conjunction with The Linux Foundation called The Hyperledger Project and R3, which is jointly funded by J.P.Morgan and Microsoft among 30 others (eg Barclays, Goldman Sachs, ING, Nomura, State Street).

While they sound like distinct entities and potential competitors, they are not. Like the open source software model on which development is based, collaboration is the name of the game. A recent article in Bitcoin Magazine notes, “The Linux foundation announced its Hyperledger project on December 17, 2015, and just one day later, 2,300 companies had requested to join. The second-largest open source foundation in the history of open source had only 450 inquiries.”

I recently attended a J.P. Morgan event for senior treasury executives of its largest corporate banking clients. The goal was to address the evolving landscape for wholesale payment processing and blockchain dominated the discussion. Lori Beer heads Technology for the Corporate and Investment Bank. She offered this perspective, which I paraphrase:

Through the use of a distributed ledger, blockchain technology allows a shared record of irrefutable events to be updated near-simultaneously across all parties to a transaction. It’s faster and more secure than previous protocols. The key is reducing friction wherever possible, increasing speed, visibility and security for our clients. Near-instantaneous transfer and settlement of funds across the bank’s global network expedites cross-border payments while minimizing traditional lifting fees and settlement inefficiencies.

Kristen Michaud, General Electric’s Managing Director of Treasury Operations also spoke at the event. She oversees 13,000 separate accounts and outlined two specific goals where blockchain could potentially play a role: 1. Raise the current threshold of payment automation from 30% to 90%; 2. Increase same-day settlement from 90% to 95%. Blockchain could transform multiple banking functions.

Blockchain as a Platform

Broader than Payments

BitcoinGrowsUp Broader than Payments

There is even an experimental peer-to-peer energy exchange in Brooklyn which uses blockchain protocol to manage energy sharing.¹ A blockchain network links about a dozen homes, all of whom generate electricity on their roofs using solar panels. When one home needs to consume more than it produces, surplus is drawn from a neighbor and a shared ledger records the transaction. Because the network is highly localized, fewer “electrons” are lost during transmission and shared data in real-time optimizes excess supply. It’s efficient on two fronts.

Here’s the point: Blockchain could revolutionize transactional record keeping across multiple industries. The harder part is figuring out how to invest in blockchain and benefit from its potential adoption. While big banks have joined with Big Tech to sponsor VC-like blockchain startups, there are few publicly traded blockchain pure plays. There are however some derivative blockchain companies we are watching very closely, specifically with an eye towards accelerated blockchain activity which could prove the catalyst for dramatic future revenue growth.

1. Nasdaq, Inc. (NDAQ) pioneered electronic trading in 1971. The company launched the first public marketplace for private companies in 2013, and now it’s actively piloting a blockchain program to settle some of its private company transactions. If a central exchange and clearing house built around innovation sees opportunity, pay attention. The integration of blockchain protocol onto its Marketplace platform is the most viable mainstream application to date.

2. Overstock.com Inc, (OSTK) has recently gained approval from the SEC to issue crypto securities which will settle according to the blockchain shared ledger protocol. While no issue date has yet been determined, the e-commerce company is effectively making itself a litmus test for blockchain as a real world settlement mechanism. If successful, the company may apply apply the method to peer-to-peer transactions (P2P). Overstock.com has launched a wholly-owned subsidiary called t0.com in order to “revolutionize the capital markets.”

3. Cognizant (CTSH) and Mizuho Securities (MFG) announced in February a strategic partnership to develop a blockchain solution for secure record-keeping of documents for all Mizuho Financial Group companies worldwide. This is really about expediting multi-party verification rather than trade processing. Per Cognizant Financial Services President Prasad Chintamaneni, “This paves the way for increased adoption of blockchain technology… into newer areas such as smart contracts and P2P transactions.”

4. The joint venture clearXchange as a future IPO? Similar to the 30-firm consortium R3, clearXchange includes several large banks and was founded in 2011 to present a viable P2P alternative to PayPal. Original backers include Bank of America, J.P. Morgan Chase and Wells Fargo. Capital One bought a 25% stake in 2014. The venture currently serves half the mobile banking customers in the U.S. according to Samsung Securities. While neither public nor purely blockchain-focused, it’s implicitly a shared ledger protocol given the scope of its user base. Most notably, transactions settle in two days virtually cost-free, compared to 6-8 days and 2.9% at PayPal.

BitcoinGrowsUp Nasdaq Overstock Cognizant Mizuo table


¹http://bit.ly/1WQr2rB Bitcoin Magazine (4/25/16)

Friends in Low Places (Issue #5.1 – 5/27/16)

Friends in Low Places

Eleven Deep Value E&Ps

  • Many energy drillers trade at significant discounts to the value of their proven reserves
  • Two-thirds of E&P companies still have at least half their credit lines available
  • A select few have lower ratios of debt to cash flow than the S&P 500 Index average
  • Production volumes lag price changes by six months, implying late summer rebound

U.S. energy assets are changing hands at cents on the dollar. The mid-May acquisition by Range Resources Corp (RRC) of Memorial Resource Development Corp. (MRD) for $4.4B represents a discount of nearly 75% off the current market value of the MRD’s 441MMboe of proven reserves at $45/bbl. Even applying realized oil and gas prices reported by MRD during Q1 of $30.10/bbl and $1.97/mcf respectively, this transaction still values MRD at less than half the value of its known reserves. NO WONDER this is the single largest acquisition by Range Resources in its history. Long-term strategic investors would be well served to emulate Range Resources CEO Jeff Ventura, accumulating shares in Exploration & Production companies with high quality assets and low levels of debt.

I knew energy assets were trading cheap, but I didn’t realize they were trading this cheap. Granted, relying solely on the value of hydrocarbons in the ground underestimates costs to both explore and extract, but I equate what’s happening in energy now to what happened to banks in 2008. Back then, JPMorgan traded down to 0.44x book… and you may recall CEO Jamie Dimon bought stock. So did then-CEO John Mack at Morgan Stanley, and Wells Fargo’s John Stumpf. Same story for the homebuilders. The environment was toxic and the outlook grim, but the assets got too cheap to ignore. Like Miami condos in 2010, Greek bonds in 2014, and energy companies today, low-priced assets with intrinsic value attract capital… and they rebound. Consider four examples.

Discounts Didn’t Last

Price to Book Ratios

FriendsLowPlaces2 Price to Book Ratios

Back to energy markets, the price paid by RRC for MRD speaks volumes, reflecting imploding metrics by nearly every measure:

• Active rigs searching for new oil and gas deposits have fallen 79% since 2014 (Baker Hughes)
• 3-yr average price declines of 50% have shut-in all but the lowest cost wells
• 63 U.S. energy companies have filed bankruptcy in 2016, a new Jan-May record
• Energy sector capital expenditures (CapEx) declined 36% in Q1 YoY (Strategas Research)
• $77B N. American energy corporates trade at less than 60 cents on the dollar (Morgan Stanley)

I had the distinct pleasure of joining legendary oilman Boone Pickens for dinner in early May with about three dozen investment managers and members of the media. Mr. Pickens is one of my all-time favorite television guests. I loved interviewing him because he’s funny, self-deprecating and razor smart. He commented at one point that “women run the oil business.” When asked to explain, he clarified that oil patch wives give their husbands about one week of “sitting on the couch with a six pack” after getting laid-off. Then the men are told in no uncertain terms to “Go get a job!” He says once they’re gone, they’re gone… wives won’t let ‘em go back to oil because it’s too unpredictable. Boone made the same point about drilling equipment, and he believes the current idling of land rigs and cold-stacking of offshore platforms will create a slingshot effect sending prices higher. Too much supply has come off market.

Put another way: The cure for low prices is low prices.

Over the past three years, oil prices have led rig activity by about 6 months, meaning price has moved first and then the equipment utilization has followed. Based on crude’s move from a low of $26 in February to the mid 40s now, we could expect to see drilling activity rebound by August if price gains are sustained. This is the corrective process Boone alluded to, and it’s bullish for energy E&P companies.

Cause & Effect

Production Follows Price

FriendsLowPlaces2 Production Follows Price

Curiously, not all E&P companies are as desperate as the headlines suggest. Bloomberg enables us to screen the universe of 106 drillers in the Russell 3000 Index to determine which companies have tapped into their credit lines based on figures reported as recently as Q1. The data is telling. Most of the companies which have tapped more than 90% of their credit lines have either filled Chapter 11 or are holding on for deal life, with stocks trading in the single digits. Some examples which come to mind include Triangle Petroleum Corp. (TPLM), W&T Offshore Inc (WTI), and Yuma Energy Inc (YUMA).

I implore you to resist the urge to contemplate stocks trading at $0.25. Many of these companies are tapped out and the stocks are just a marker for equity holders who hung on way too long. They are not cheap. They are worthless… their secured bonds may offer value but their equity does not. As evidence, recall former highflying SandRidge Energy (SDOCQ), which borrowed 98% of its credit line. The stock broke $1 a year ago and in mid-May went poof. Ditto for Breitburn Energy Partners (BBEP). In the past two weeks, Chesapeake Energy (CHK) has twice diluted equity investors by a total of 9.4% as it swaps old debt for new shares. I want no part of this action.

Instead, I’m focusing on well-capitalized companies which have barely tapped their credit lines, and there are more than you might suspect. Nearly two-thirds of the 106 companies we examined still had at least half of their credit lines available as of April 1, 2016. Almost half haven’t even touched them This is good. As we begin our process of narrowing down the few E&P companies we actually want to own, this is our starting point. We like tight-fisted drillers.

Tight Fisted

Credit Line Available

FriendsLowPlaces2 Credit Line Available

Having narrowed our universe of investable E&P candidates to the 76 which still have at least half their credit lines available, we focus on Low Debt, Low Valuation and High Survivability. Here’s our criteria more specifically:

• Total Debt is less than $7 per Barrel of Oil Equivalent (BOE)… manageable debt load
• Net Debt to cash flow (EBITDA) is less than 3.1x… ditto
• Enterprise Value (EV) to BOE Reserves is less than 0.9x… cheap, Cheap, CHEAP
• EBITDA for 2016 is at least half the amount during 2015… they’ve cut back but are still operating
• Strong analyst conviction… mostly buy ratings and only one, or no sells

Eleven names from the original list of 106 made the list: Cabot Oil & Gas (CBT), Callon Petroluem (CPE), Concho Resources (CXO), Earthstone Energy (ESTE), EOG Resources (EOG), EQT Corp (EQT), Gulfport Energy (GPOR), Matador Resources (MTDR), Newfield Exploration (NFX), PDC Energy (PDC), Rice Energy (RICE).

In order to estimate the dollar value of proven reserves, I first multiplied barrels of oil equivalent (BOE) by $45 for producers with at least 50% production weighted to oil, and by $30 for “gassier” names. I then subtracted average lifting costs of $8.50/BOE and average transportation costs of $3/BOE. As a result, proven reserves reflect prices closer to actual realized prices, which is a more conservative way to estimate valuation. An even more rigorous analysis could itemize individual well-head costs and model depletion over time… but let’s not get too carried away.

A few important observations:
1. These companies are extremely cheap, trading at an average of 0.74 times the value of proven reserves. Banks and homebuilders traded at comparable valuations relative to book value in 2008, and have since risen by multiples.

2. Net debt to cashflow for the group equals 1.5x, which is LESS than the average of 2.2x for the S&P 500 Index. These companies are well-capitalized and in little danger of imploding. They are survivors, which is why many have not even tapped their credit lines. They don’t need to.

3. Both EOG and Concho made the cut, which is key. Nearly every energy analyst I interviewed at BloombergTV over several years told me these are the only two E&Ps which consistently fund new drilling projects from cash flow on existing wells. They are conservative, well-run and in-business for the long haul. Their inclusion on my list confirms the screening criteria is on point.

4. Barrels per Oil Equivalent (BOE) indicates the company’s audited and best estimate of proven reserves in the ground as of December 31, 2015. It includes both developed and undeveloped reserves. It does not include probable reserves, so actual reserves may be higher, and valuation cheaper.

Cheap, Low Debt & Lots of Oil

10 E&P Companies to Own

FriendsLowPlaces2 10 E&P Companies to Own


Last Tree Standing (Issue #4.3 – 5/13/16)

Last Tree Standing

One Lender Still Faces the Axe

  • Online lenders cut in half since April will NOT recover
  • Four governmental regulatory bodies now examining marketplace loan practices
  • Bloated cost structures undermine the legitimacy of top line growth
  • Lending Tree (TREE) will fall to the forest floor like its competitors

Marketplace lenders were supposed to transform borrowing the way Priceline (PCLN) transformed travel, uniting buyers and sellers on a common platform so they could agree on a price and consummate a deal.

There is only one problem: The concept is failing in spectacular fashion. During the first two weeks of May, On Deck Financial, Inc. (ONDK) lost double the estimate for Q1, LendingClub Corp. (LC) fired its CEO for selling $22M of loans which failed to meet investors’ criteria, and underwriters at Goldman Sachs and Jefferies suspended pending loan securitizations. Only Lending Tree (TREE) still stands… barely. All ten analysts rate shares a Buy, but no tree can withstand gale force winds indefinitely.

Relentless Selling

Which of these is not like the other?

TImber Relentless Selling

If a tree falls in the forest, and no one’s there, does it still make a sound? Answer: Yes, just ask the regulators. Four governmental agencies are now examining the business of online lending, and their prying eyes are sending tremors through the industry. The Federal Trade Commission recently joined Treasury, the FDIC and Elizabeth Warren’s Consumer Financial Protection Bureau in trying to better understand whether consumers might be unwittingly opening themselves up to predatory lending practices.

This bad for anyone still long Lending Tree, as Government tends to have a heavy and indiscriminating hand. Former American Banking Association President Frank Keating told me regulatory changes created by Dodd-Frank legislation “raised operating costs for traditional Main Street lenders by an average of 17%, even though they have nothing to do with capital markets.” Sadly for the marketplace lenders, their business models have everything to do with capital markets, as secondary loan securitization is essential to recycling capital and generating earnings growth.

Now, before we get too bogged down by the negatives (though we’re getting there quickly) let’s start with the noble promise of making more credit more available to more people. Just as companies like Uber and Fresh Direct have harnessed connectivity to enhance fulfillment and customize choice, FinTech innovators have created a number of new platforms to connect consumers and capital more directly. As a result, total online loan origination rose to $37B in 2015, up from virtually zero in less than five years, according to Autonomous Research.

Dozens of private lending companies with names like Rapid Advance and Multifunding LLC now compete online to offer loans with significantly less friction than traditional underwriters. Many of their processes are automated by algorithms analyzing digitized documents on servers far away from expensive branch offices, meaning they can process loans faster and at lower cost than traditional banks. Often, borrowers get approved the same day they apply, and funds are wired within the week. These so-called marketplace lenders have prospered by stepping into the void left by banks still repairing balance sheets after more than $1.1T of write downs since 2008.

On Deck estimates $80-120B in demand for small business loans went unfulfilled in 4Q16, compared to actual loan volume of $193B. So On Deck has been busy writing business, but as the recent earnings miss demonstrates, buying business at the margin can be very expensive. Loan loss reserves rose and securitization fell, which is a double whammy. Loan quality is falling so fewer people are willing to buy the company’s loans in the after market. To quote J.P. Morgan analyst Richard Shane (who rates ONDK a hold):

“The high level of credit risks inherent is ONDK’s high yield portfolio remain difficult to assess given the company’s reliance on its proprietary algorithm for determining credit risks. As credit risk management is critical to sustaining ONDK’s robust growth, we remain watchful with regard to the effectiveness of its credit assessment algorithms.”

On Deck uses use its own capital to make loans, so its position and opacity make it particularly problematic, which is also why it’s a single digit stock. Lending Tree, by contrast acts as a neutral or third party marketplace, introducing borrowers and lenders. Even so, Lending Tree still faces multiple challenges.

Timber Quarterly revenues
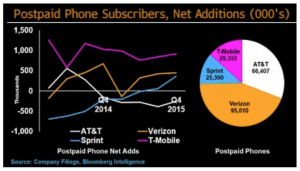
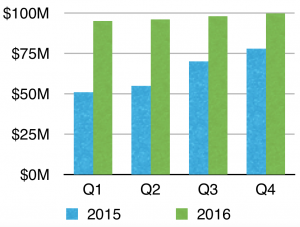
1. Flat Quarterly Revenues
Lending Tree’s top line has gone from Growth Miracle in 2015 to Miracle Gro wanted in 2016. Whereas last year’s revenue rose from $51M in Q1 to $78M in Q4, management recently guided analysts to $95M per quarter this years… for all four quarters. When an exasperated analyst f rom BWS Financial exclaimed, “$95M per quarter for all four quarter means zero sequential growth” the CEO responded “I need to look at the numbers.” So here they are in green, ironically: Zero sequential growth.

2. Extremely High Costs
Anyone who follows Amazon knows that on-line profit margins can be notoriously thin, so thin that supermarkets at 2-3% actually look robust! Welcome to the world of online lending. In theory, operating a marketplace without the burden of branch offices along Main Street should be cheap. It’s not. Customer acquisition is EXTREMELY expensive. Lending Tree spends 59% of revenue on advertising. Lending Tree’s total SG&A expense (Sales, General & Administrative) equates to 80% of total revenue, the second highest of all 1500 stocks in the S&P 1500 Index. Think of it this way, Lending Tree spends 80 cents to make 20 cents, meaning there’s very little room for error. Do YOU want to be in that business?

3. Expensive Middleman
Lending Tree proudly highlights it lending partners in the company presentation. Wells Fargo figures prominently in several categories, as it should… accounting for about one in five mortgages in the U.S. But does Wells Fago really need Lending Tree? It’s already Goliath. And why should lenders like Chase and Citi pay 50-400 basis points per loan for customer introduction? Curiously, On Deck is a Lending Tree customer. So is SoFi, which pitches itself to Millenials in need money as “awesome” and describes markets as “weird.” I remember when institutional stock brokers charged 12 cents/share, and now it’s less than a penny. Real estate brokers once collected 10%. Disintermediation works when process is simplified and cost is lowered, not when a new layer is inserted. Sorry Lending Tree, you are not mission critical.

Timber pic2

4. People as Product

I suspect we will learn over time that the four regulatory agencies examining Lending Tree will express concern over fundamental conflicts of interest inherent in the structure of its business. The key issue is its definition of Customer. Per the original S-1 registration document filed with the SEC in 2008:

Access to Supply: Tree.com provides lending and real estate network partners with important customer acquisition channels. Tree.com believes the ability of its partners to reach a large qualifies audience through its brands and businesses is a significant benefit. Tree.com com offers customers the choice of multiple suppliers in one setting.

This paragraph clearly identifies banks are partners of Lending Tree, using the online platform for “customer acquisition.” Several questions arise:
• But does this imply the borrowers are product, or are borrowers customers?
• Are banking partners also customers?
• Can a market place fairly represent both sides without providing total transparency, especially when proprietary algorithms process the data?
• Should we interpret “multiple suppliers” as the banks supplying capital or the borrowers supply

I offer no answers, but I am confident that dozens of lawyers laboring at four agencies can create enough uncertainty and overhang to pressure this sector for a long time. Regulators strung out the debate over for-profit college loan abuse for several years. Similarly, banks are still settling suits from 2008, and even BP is not clear of its 2010 oil spill. This debate will drag on for years.

Bottom Line: Lending Tree is a long-term, structural short position. It’s growth has slowed, its costs are high, it may ultimately prove less relevant to existing partners and regulators have dug in.

Lending Tree will also prove a challenging position to trade for two key reasons: The company has expressed considerable interest in buying shares in the below $70, as it did during the February sell-off; and short interest exceeds 40% of float, meaning it could be subject to a massive short cover rally. That said, the long-term chart clearly indicates a deteriorating trend and plenty of room to the downside.

Lower Highs & Long Way to Zero

Lending Tree (TREE)

Timber graph

Copyright 2016 Bloomberg Finance L.P.

Culture Club (Issue #4.2 – 5/13/16)

Culture Club

15 “Best Places to Work” … and Own

  • Companies prioritizing people significantly outperform the S&P 500 Index
  • Cutting employee turnover in half improves operating budgets up to 6%
  • Seven Secrets to inspire, motivate and retain talent
  • The man who humanizes money management https://www.youtube.com/embed/dumAFMBisSo


Fortune Magazine publishes its annual ranking of 100 “Best Places to Work” and wealth management firm Edward Jones makes the list for 17 years running. We expect places like Google to attract accolades –with free gourmet lunches, onsite laundry service and lego play rooms– but a place where you buy life insurance and fund a 401(k)? Admittedly we were surprised, especially since the firm had made the cut so many times. Then Fortune invited us to meet the person at the helm of this decades old partnership, Managing Partner Jim Weddle (link to interview https://www.youtube.com/embed/dumAFMBisSo). We soon realized Jim is not only doing something right, but knows exactly what he’s doing.

Jim joined the company back in the 1970s, fresh out of business school. He admits his work ethic was “pretty good but still needed encouragement from time to time.” So a senior partner quietly took Jim under his wing, and within a couple years asked him to open a new office in rural Indiana. Jim prided himself on knowing the name of every client who walked in the door and always having a fresh pot of coffee in the pantry… generally starting at 6am. Several years later Jim was asked to oversee the entire retail network. Today Edward Jones has over 11,000 locations.

Jim’s small town charm has produced big time results, in part because he’s figured out how to quantify a culture and implement at scale. Fortune tracks these metrics to determine its annual ranking of Best Place to Work. So does Bloomberg, in its own version called a Social Disclosure Score. SDS measures factors like employee turnover, gender equality, and corporate governance. As we can see from the data, SDS has as much impact on shareholders as employees.

Nice Guys Finish First

SDS Portfolio Outperforms

Based on rebalancing the portfolio every six months and back testing over a ten year period ended March 31, top-ranked SDS companies significantly outperformed the broader market, returning 165% compared to 97% for the S&P 500. Whether looking at Fortune’s ranking or Bloomberg’s data, the point here is obvious: Positive culture is positive for shareholders.

While Bloomberg’s SDS ranking is based solely on numerical measures, Fortune’s methodology merges qualitative information with quantitative data. We counted 51 separate categories on which companies are judged, not to mention hundreds of written responses from surveyed employees. For those of us who generally opt for data over anecdote, and yet still appreciate the softer side of due diligence, this approach is very satisfying. Fortune’s process is exceptionally rigorous. In broad terms, Fortune’s criteria integrates two parallel data sets:

  • Trust Index Employee Survey (67%) asks a random sample of employees to rate multiple factors like management credibility, job satisfaction, and co-worker camaraderie.
  • Culture Audit (33%) measures specific metrics like compensation, benefits, turnover, hiring practices, methods of internal communication, training, recognition programs, and diversity efforts.

Turnover says a lot about a company’s culture, and the Fortune team notes the 100 Best Place to Work 2016 have half the turnover rate of non-ranked companies. In the notoriously volatile hospitality industry for example, 46% of employees leave every year, compared to just 21% for related companies which made the Fortune list. Accounting for the resulting loss to productivity, a 2006 white paper co-written by PricewaterhouseCoopers and the Saratoga Institute estimates resignations cost companies 90-200% of the departing employee’s base salary, ultimately adding 12% annually to enterprise operating budgets. By implication, cutting turnover in half reduces overhead by 6%, which in turn boosts margins and net income. So Fortune digs deep to figure out what keeps people loyal. Here’s Fortune’s take on Connecting People & Purpose: 7 Ways High-Trust Organizations Retain Talent.

CultureClub Define Your Company's Purpose

At Edward Jones, the formula includes a powerful combination of mentoring, regular video town halls, generous incentive rewards, a priority on long-term growth over short-term metrics and a compelling sense of mission. As Jim told me, “What we do matters… and private partnership creates collaboration that supports robust mentoring across our firm… it’s also a significant strategic advantage. We are able to make decisions with a longer-term horizon.

Having worked at both large public companies and small private partnerships, we agree wholeheartedly. Non-public companies can afford to take a longer-term view towards people and productivity. There’s only once catch: We cannot invest in private companies. So we consider only those 35 companies on Fortune’s 100 Best Place to Work which are public, narrowing the list to 15 based on our own criteria.

I’ve highlighted in green those companies with positive cumulative returns since joining the index, as well as those which have outperformed the S&P 500 over the same period. Underperformance by either measure is noted in red. Additionally, we’ve highlighted in yellow those companies whose 2016 earnings estimates exceed 10% AND whose returns are positive by both measures.

CultureClub Company ranking table

We observe the following from the data:

  • 29 of 35 public companies currently ranked by Fortune have returned positive results for shareholders while on the list of 100 Best Places to Work.
  • 25 of the 29 have also outperformed the S&P 500 Index during the same period.
  • On average, current public companies ranked have made the list for 9.2 years.
  • The average cumulative return for these companies while on the list has been 175%.
  • Average outperformance compared to the S&P 500 Index has been 121%

While I would never buy a company simply because it has made Fortune’s list of 100 Best Places to Work, the data clearly illuminates the correlation between positive corporate culture and superior stock performance over time. An impressive 71% of public companies currently ranked by Fortune (25 of 35) have outperformed the S&P 500 Index while on the list, and the margin of outperformance has been significant.

I chose to highlight in yellow the 15 companies with 2016 earnings growth estimates exceeding 10% because growth is especially hard to find in the current environment. In fact, S&P 500 earnings for Q1 will likely constitute a third consecutive quarterly decline, the longest stretch since 2008. So we are being particularly narrow in our focus. We want culture AND we want results.

Culture and Growth

12-mo Returns through Q1

CultureClub 12-mo Returns through Q1

Of the fifteen “10% Growers” highlighted in yellow, we note 9 have posted positive returns for the 12 months ended March 31, 2016 while 6 have declined. The average return for the group of fifteen is 6.1%, compared to a decline of 2.1% for the S&P 500 Index.